Chilean Female Disability
COMPARE
Chilean
Select to Compare
Female Disability
Chilean Female Disability
11.5%
DISABILITY | FEMALES
99.8/ 100
METRIC RATING
72nd/ 347
METRIC RANK
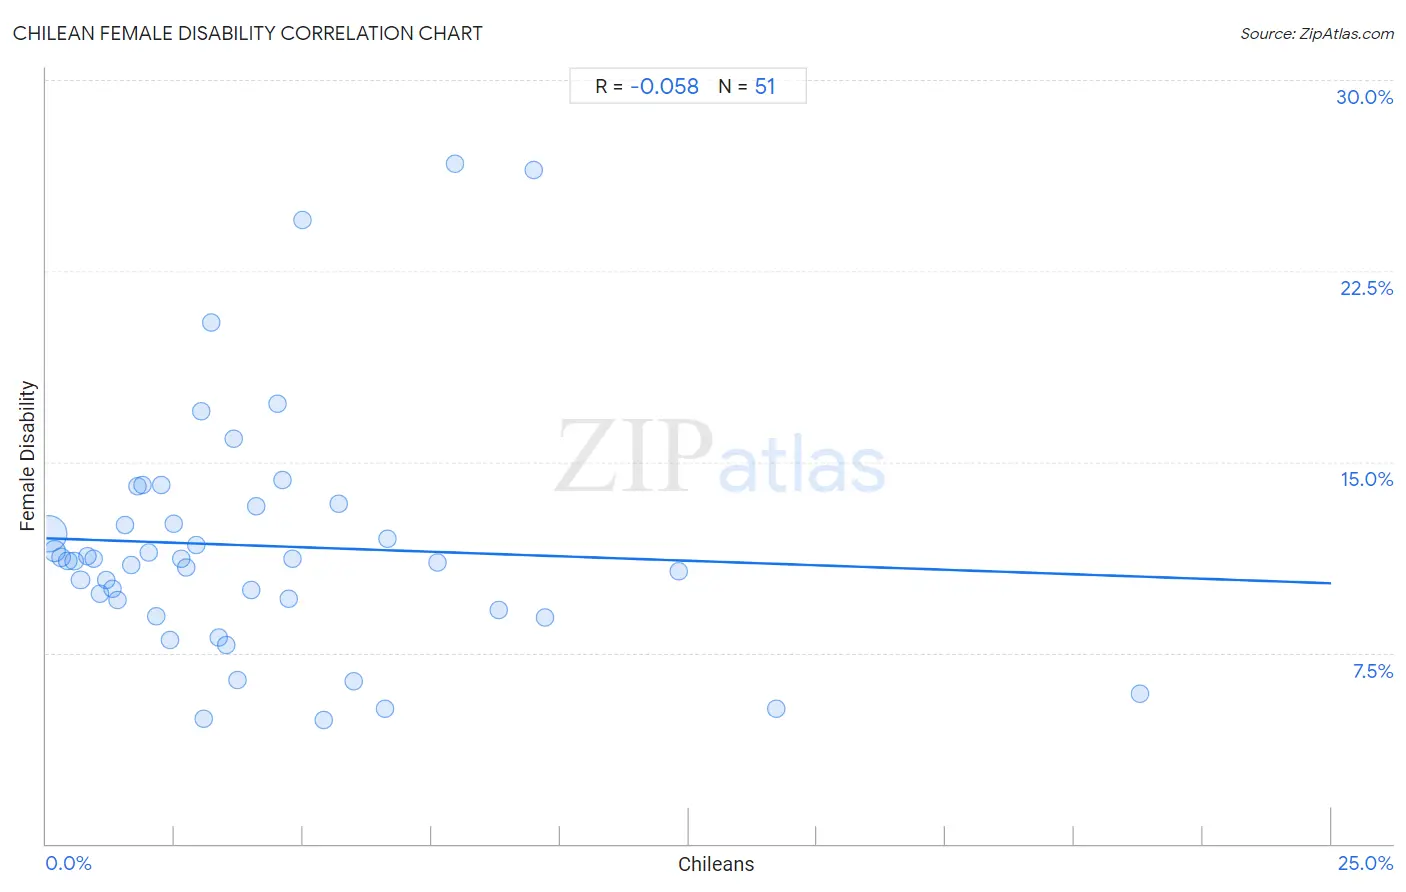
Chilean Female Disability Correlation Chart
The statistical analysis conducted on geographies consisting of 256,651,441 people shows a slight negative correlation between the proportion of Chileans and percentage of females with a disability in the United States with a correlation coefficient (R) of -0.058 and weighted average of 11.5%. On average, for every 1% (one percent) increase in Chileans within a typical geography, there is a decrease of 0.071% in percentage of females with a disability.
It is essential to understand that the correlation between the percentage of Chileans and percentage of females with a disability does not imply a direct cause-and-effect relationship. It remains uncertain whether the presence of Chileans influences an upward or downward trend in the level of percentage of females with a disability within an area, or if Chileans simply ended up residing in those areas with higher or lower levels of percentage of females with a disability due to other factors.
Demographics Similar to Chileans by Female Disability
In terms of female disability, the demographic groups most similar to Chileans are Immigrants from Switzerland (11.5%, a difference of 0.020%), Immigrants from Ireland (11.5%, a difference of 0.070%), Bhutanese (11.5%, a difference of 0.090%), Immigrants from Chile (11.5%, a difference of 0.11%), and Colombian (11.5%, a difference of 0.12%).
| Demographics | Rating | Rank | Female Disability |
| Immigrants from South America | 99.9 /100 | #65 | Exceptional 11.4% |
| Salvadorans | 99.8 /100 | #66 | Exceptional 11.5% |
| Immigrants from Vietnam | 99.8 /100 | #67 | Exceptional 11.5% |
| Immigrants from Northern Africa | 99.8 /100 | #68 | Exceptional 11.5% |
| Colombians | 99.8 /100 | #69 | Exceptional 11.5% |
| Immigrants from Chile | 99.8 /100 | #70 | Exceptional 11.5% |
| Immigrants from Ireland | 99.8 /100 | #71 | Exceptional 11.5% |
| Chileans | 99.8 /100 | #72 | Exceptional 11.5% |
| Immigrants from Switzerland | 99.8 /100 | #73 | Exceptional 11.5% |
| Bhutanese | 99.8 /100 | #74 | Exceptional 11.5% |
| Immigrants from Lebanon | 99.7 /100 | #75 | Exceptional 11.5% |
| Immigrants from Eritrea | 99.7 /100 | #76 | Exceptional 11.5% |
| Immigrants from Afghanistan | 99.7 /100 | #77 | Exceptional 11.5% |
| Immigrants from South Africa | 99.7 /100 | #78 | Exceptional 11.5% |
| Sierra Leoneans | 99.7 /100 | #79 | Exceptional 11.5% |
Chilean Female Disability Correlation Summary
| Measurement | Chilean Data | Female Disability Data |
| Minimum | 0.054% | 4.8% |
| Maximum | 21.3% | 26.7% |
| Range | 21.2% | 21.8% |
| Mean | 4.2% | 11.7% |
| Median | 3.1% | 11.1% |
| Interquartile 25% (IQ1) | 1.5% | 9.2% |
| Interquartile 75% (IQ3) | 5.4% | 13.3% |
| Interquartile Range (IQR) | 3.9% | 4.1% |
| Standard Deviation (Sample) | 4.0% | 4.8% |
| Standard Deviation (Population) | 3.9% | 4.7% |
Correlation Details
| Chilean Percentile | Sample Size | Female Disability |
[ 0.0% - 0.5% ] 0.054% | 182,404,440 | 12.2% |
[ 0.0% - 0.5% ] 0.17% | 41,280,004 | 11.5% |
[ 0.0% - 0.5% ] 0.30% | 15,256,434 | 11.2% |
[ 0.0% - 0.5% ] 0.42% | 6,590,028 | 11.1% |
[ 0.5% - 1.0% ] 0.54% | 3,916,163 | 11.1% |
[ 0.5% - 1.0% ] 0.67% | 2,217,883 | 10.4% |
[ 0.5% - 1.0% ] 0.80% | 1,585,601 | 11.3% |
[ 0.5% - 1.0% ] 0.92% | 1,012,652 | 11.2% |
[ 1.0% - 1.5% ] 1.04% | 672,042 | 9.8% |
[ 1.0% - 1.5% ] 1.16% | 515,327 | 10.4% |
[ 1.0% - 1.5% ] 1.28% | 334,371 | 10.0% |
[ 1.0% - 1.5% ] 1.40% | 131,593 | 9.6% |
[ 1.5% - 2.0% ] 1.53% | 93,560 | 12.5% |
[ 1.5% - 2.0% ] 1.66% | 126,142 | 11.0% |
[ 1.5% - 2.0% ] 1.79% | 87,104 | 14.1% |
[ 1.5% - 2.0% ] 1.88% | 80,991 | 14.1% |
[ 2.0% - 2.5% ] 2.00% | 35,881 | 11.4% |
[ 2.0% - 2.5% ] 2.15% | 21,992 | 8.9% |
[ 2.0% - 2.5% ] 2.24% | 40,477 | 14.1% |
[ 2.0% - 2.5% ] 2.40% | 15,299 | 8.0% |
[ 2.0% - 2.5% ] 2.49% | 10,114 | 12.5% |
[ 2.5% - 3.0% ] 2.62% | 1,907 | 11.2% |
[ 2.5% - 3.0% ] 2.72% | 16,418 | 10.8% |
[ 2.5% - 3.0% ] 2.93% | 9,503 | 11.7% |
[ 3.0% - 3.5% ] 3.01% | 19,160 | 17.0% |
[ 3.0% - 3.5% ] 3.07% | 29,211 | 4.9% |
[ 3.0% - 3.5% ] 3.21% | 8,104 | 20.5% |
[ 3.0% - 3.5% ] 3.35% | 20,448 | 8.1% |
[ 3.0% - 3.5% ] 3.50% | 2,573 | 7.8% |
[ 3.5% - 4.0% ] 3.64% | 3,567 | 15.9% |
[ 3.5% - 4.0% ] 3.72% | 3,035 | 6.4% |
[ 3.5% - 4.0% ] 3.98% | 19,917 | 9.9% |
[ 4.0% - 4.5% ] 4.08% | 29,406 | 13.3% |
[ 4.5% - 5.0% ] 4.50% | 3,620 | 17.3% |
[ 4.5% - 5.0% ] 4.60% | 14,361 | 14.3% |
[ 4.5% - 5.0% ] 4.73% | 3,745 | 9.6% |
[ 4.5% - 5.0% ] 4.80% | 917 | 11.2% |
[ 4.5% - 5.0% ] 4.99% | 1,022 | 24.5% |
[ 5.0% - 5.5% ] 5.40% | 1,259 | 4.8% |
[ 5.5% - 6.0% ] 5.68% | 3,943 | 13.3% |
[ 5.5% - 6.0% ] 5.99% | 1,904 | 6.4% |
[ 6.5% - 7.0% ] 6.60% | 985 | 5.3% |
[ 6.5% - 7.0% ] 6.64% | 4,169 | 12.0% |
[ 7.5% - 8.0% ] 7.62% | 8,450 | 11.1% |
[ 7.5% - 8.0% ] 7.95% | 1,622 | 26.7% |
[ 8.5% - 9.0% ] 8.81% | 7,307 | 9.2% |
[ 9.0% - 9.5% ] 9.49% | 2,612 | 26.4% |
[ 9.5% - 10.0% ] 9.70% | 1,732 | 8.9% |
[ 12.0% - 12.5% ] 12.30% | 732 | 10.7% |
[ 14.0% - 14.5% ] 14.21% | 957 | 5.3% |
[ 21.0% - 21.5% ] 21.27% | 757 | 5.9% |