Chilean 3 or more Vehicles in Household

COMPARE

Chilean
Race
Ancestry
AfghanAfricanAlaska NativeAlaskan AthabascanAlbanianAleutAlsatianAmericanApacheArabArapahoArgentineanArmenianAssyrian/Chaldean/SyriacAustralianAustrianBahamianBangladeshiBarbadianBasqueBelgianBelizeanBermudanBhutaneseBlackfeetBolivianBrazilianBritishBritish West IndianBulgarianBurmeseCajunCambodianCanadianCape VerdeanCarpatho RusynCelticCentral AmericanCentral American IndianCherokeeCheyenneChickasawChileanChineseChippewaChoctawColombianColvilleComancheCosta RicanCreeCreekCroatianCrowCubanCypriotCzechCzechoslovakianDanishDelawareDominicanDutchDutch West IndianEastern EuropeanEcuadorianEgyptianEnglishEstonianEthiopianEuropeanFijianFilipinoFinnishFrenchFrench American IndianFrench CanadianGermanGerman RussianGhanaianGreekGuamanian/ChamorroGuatemalanGuyaneseHaitianHmongHonduranHopiHoumaHungarianIcelanderIndian (Asian)IndonesianInupiatIranianIraqiIrishIroquoisIsraeliItalianJamaicanJapaneseJordanianKenyanKiowaKoreanLaotianLatvianLebaneseLiberianLithuanianLumbeeLuxembourgerMacedonianMalaysianMalteseMarshalleseMenomineeMexicanMexican American IndianMongolianMoroccanNative HawaiianNavajoNepaleseNew ZealanderNicaraguanNigerianNorthern EuropeanNorwegianOkinawanOsageOttawaPaiutePakistaniPalestinianPanamanianParaguayanPennsylvania GermanPeruvianPimaPolishPortuguesePotawatomiPuebloPuerto RicanPuget Sound SalishRomanianRussianSalvadoranSamoanScandinavianScotch-IrishScottishSeminoleSenegaleseSerbianShoshoneSierra LeoneanSiouxSlavicSlovakSloveneSomaliSouth AfricanSouth AmericanSouth American IndianSoviet UnionSpaniardSpanishSpanish AmericanSpanish American IndianSri LankanSubsaharan AfricanSudaneseSwedishSwissSyrianTaiwaneseThaiTlingit-HaidaTohono O'OdhamTonganTrinidadian and TobagonianTsimshianTurkishU.S. Virgin IslanderUgandanUkrainianUruguayanUteVenezuelanVietnameseWelshWest IndianYakamaYaquiYugoslavianYumanYup'ikZimbabwean
Immigration
NonimmigrantsImmigrantsAfghanistanAfricaAlbaniaArgentinaArmeniaAsiaAustraliaAustriaBahamasBangladeshBarbadosBelarusBelgiumBelizeBoliviaBosnia and HerzegovinaBrazilBulgariaBurma/MyanmarCabo VerdeCambodiaCameroonCanadaCaribbeanCentral AmericaChileChinaColombiaCongoCosta RicaCroatiaCubaCzechoslovakiaDenmarkDominicaDominican RepublicEastern AfricaEastern AsiaEastern EuropeEcuadorEgyptEl SalvadorEnglandEritreaEthiopiaEuropeFijiFranceGermanyGhanaGreeceGrenadaGuatemalaGuyanaHaitiHondurasHong KongHungaryIndiaIndonesiaIranIraqIrelandIsraelItalyJamaicaJapanJordanKazakhstanKenyaKoreaKuwaitLaosLatin AmericaLatviaLebanonLiberiaLithuaniaMalaysiaMexicoMicronesiaMiddle AfricaMoldovaMoroccoNepalNetherlandsNicaraguaNigeriaNorth AmericaNorth MacedoniaNorthern AfricaNorthern EuropeNorwayOceaniaPakistanPanamaPeruPhilippinesPolandPortugalRomaniaRussiaSaudi ArabiaScotlandSenegalSerbiaSierra LeoneSingaporeSomaliaSouth AfricaSouth AmericaSouth Central AsiaSouth Eastern AsiaSouthern EuropeSpainSri LankaSt. Vincent and the GrenadinesSudanSwedenSwitzerlandSyriaTaiwanThailandTrinidad and TobagoTurkeyUgandaUkraineUruguayUzbekistanVenezuelaVietnamWest IndiesWestern AfricaWestern AsiaWestern EuropeYemenZaireZimbabweAzores
Select to Compare
Race
Ancestry
AfghanAfricanAlaska NativeAlaskan AthabascanAlbanianAleutAlsatianAmericanApacheArabArapahoArgentineanArmenianAssyrian/Chaldean/SyriacAustralianAustrianBahamianBangladeshiBarbadianBasqueBelgianBelizeanBermudanBhutaneseBlackfeetBolivianBrazilianBritishBritish West IndianBulgarianBurmeseCajunCambodianCanadianCape VerdeanCarpatho RusynCelticCentral AmericanCentral American IndianCherokeeCheyenneChickasawChineseChippewaChoctawColombianColvilleComancheCosta RicanCreeCreekCroatianCrowCubanCypriotCzechCzechoslovakianDanishDelawareDominicanDutchDutch West IndianEastern EuropeanEcuadorianEgyptianEnglishEstonianEthiopianEuropeanFijianFilipinoFinnishFrenchFrench American IndianFrench CanadianGermanGerman RussianGhanaianGreekGuamanian/ChamorroGuatemalanGuyaneseHaitianHmongHonduranHopiHoumaHungarianIcelanderIndian (Asian)IndonesianInupiatIranianIraqiIrishIroquoisIsraeliItalianJamaicanJapaneseJordanianKenyanKiowaKoreanLaotianLatvianLebaneseLiberianLithuanianLumbeeLuxembourgerMacedonianMalaysianMalteseMarshalleseMenomineeMexicanMexican American IndianMongolianMoroccanNative HawaiianNavajoNepaleseNew ZealanderNicaraguanNigerianNorthern EuropeanNorwegianOkinawanOsageOttawaPaiutePakistaniPalestinianPanamanianParaguayanPennsylvania GermanPeruvianPimaPolishPortuguesePotawatomiPuebloPuerto RicanPuget Sound SalishRomanianRussianSalvadoranSamoanScandinavianScotch-IrishScottishSeminoleSenegaleseSerbianShoshoneSierra LeoneanSiouxSlavicSlovakSloveneSomaliSouth AfricanSouth AmericanSouth American IndianSoviet UnionSpaniardSpanishSpanish AmericanSpanish American IndianSri LankanSubsaharan AfricanSudaneseSwedishSwissSyrianTaiwaneseThaiTlingit-HaidaTohono O'OdhamTonganTrinidadian and TobagonianTsimshianTurkishU.S. Virgin IslanderUgandanUkrainianUruguayanUteVenezuelanVietnameseWelshWest IndianYakamaYaquiYugoslavianYumanYup'ikZimbabwean
Immigration
NonimmigrantsImmigrantsAfghanistanAfricaAlbaniaArgentinaArmeniaAsiaAustraliaAustriaBahamasBangladeshBarbadosBelarusBelgiumBelizeBoliviaBosnia and HerzegovinaBrazilBulgariaBurma/MyanmarCabo VerdeCambodiaCameroonCanadaCaribbeanCentral AmericaChileChinaColombiaCongoCosta RicaCroatiaCubaCzechoslovakiaDenmarkDominicaDominican RepublicEastern AfricaEastern AsiaEastern EuropeEcuadorEgyptEl SalvadorEnglandEritreaEthiopiaEuropeFijiFranceGermanyGhanaGreeceGrenadaGuatemalaGuyanaHaitiHondurasHong KongHungaryIndiaIndonesiaIranIraqIrelandIsraelItalyJamaicaJapanJordanKazakhstanKenyaKoreaKuwaitLaosLatin AmericaLatviaLebanonLiberiaLithuaniaMalaysiaMexicoMicronesiaMiddle AfricaMoldovaMoroccoNepalNetherlandsNicaraguaNigeriaNorth AmericaNorth MacedoniaNorthern AfricaNorthern EuropeNorwayOceaniaPakistanPanamaPeruPhilippinesPolandPortugalRomaniaRussiaSaudi ArabiaScotlandSenegalSerbiaSierra LeoneSingaporeSomaliaSouth AfricaSouth AmericaSouth Central AsiaSouth Eastern AsiaSouthern EuropeSpainSri LankaSt. Vincent and the GrenadinesSudanSwedenSwitzerlandSyriaTaiwanThailandTrinidad and TobagoTurkeyUgandaUkraineUruguayUzbekistanVenezuelaVietnamWest IndiesWestern AfricaWestern AsiaWestern EuropeYemenZaireZimbabweAzores
3 or more Vehicles in Household
Income
Poverty
Unemployment
Labor Participation
Family Structure
Vehicle Availability
Education Level
Disability

Chilean 3 or more Vehicles in Household
Good

19.7%
3+ VEHICLES AVAILABLE
63.0/ 100
METRIC RATING
163rd/ 347
METRIC RANK

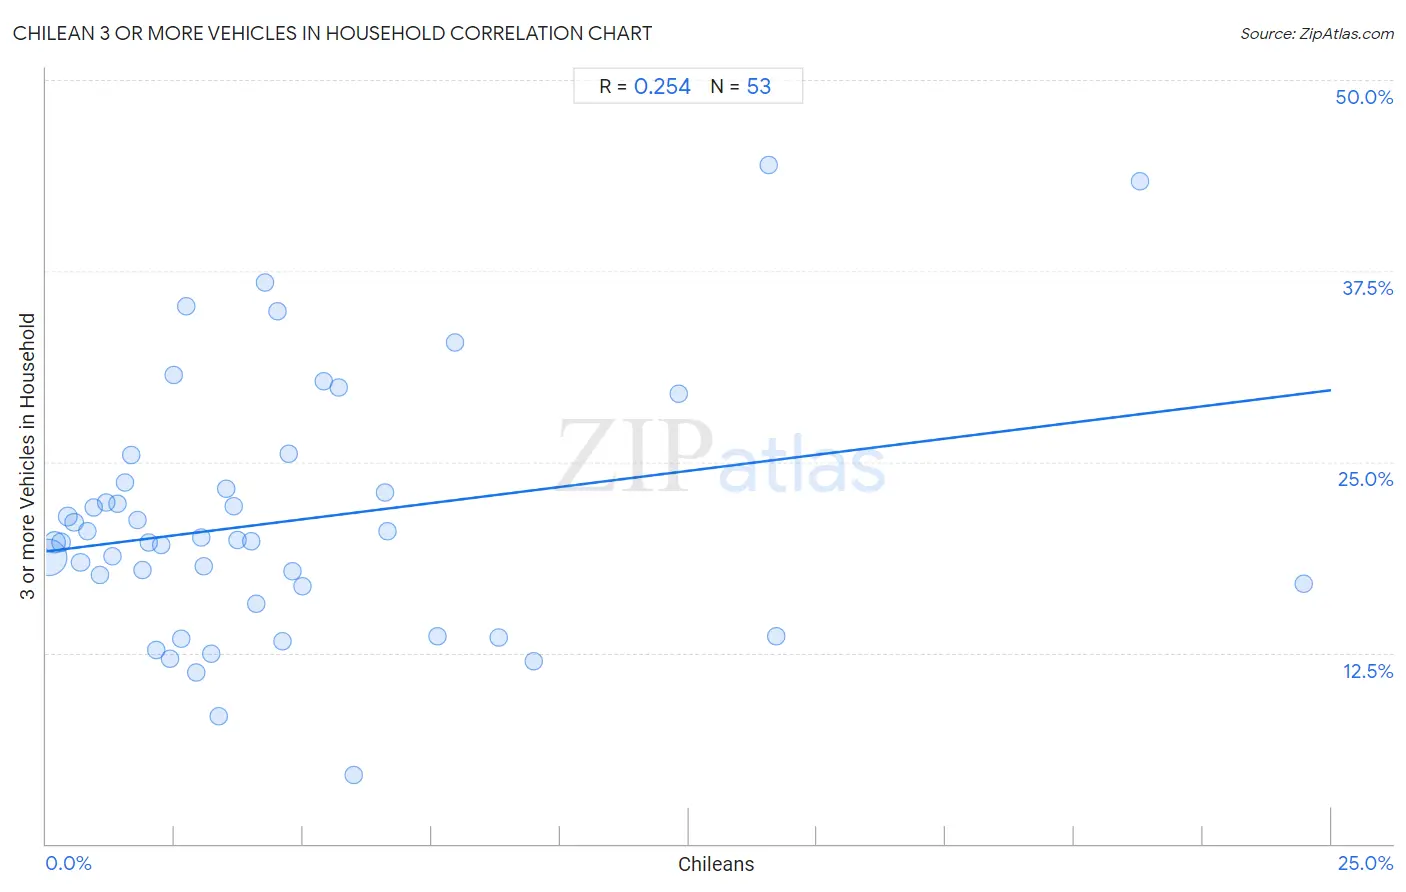
Chilean 3 or more Vehicles in Household Correlation Chart

The statistical analysis conducted on geographies consisting of 256,506,401 people shows a weak positive correlation between the proportion of Chileans and percentage of households with 3 or more vehicles available in the United States with a correlation coefficient (R) of 0.254 and weighted average of 19.7%. On average, for every 1% (one percent) increase in Chileans within a typical geography, there is an increase of 0.42% in percentage of households with 3 or more vehicles available.
Chilean 3 or more Vehicles in Household
It is essential to understand that the correlation between the percentage of Chileans and percentage of households with 3 or more vehicles available does not imply a direct cause-and-effect relationship. It remains uncertain whether the presence of Chileans influences an upward or downward trend in the level of percentage of households with 3 or more vehicles available within an area, or if Chileans simply ended up residing in those areas with higher or lower levels of percentage of households with 3 or more vehicles available due to other factors.

Demographics Similar to Chileans by 3 or more Vehicles in Household

In terms of 3 or more vehicles in household, the demographic groups most similar to Chileans are Yugoslavian (19.7%, a difference of 0.010%), Estonian (19.7%, a difference of 0.020%), Immigrants from Costa Rica (19.7%, a difference of 0.090%), Immigrants from Cameroon (19.7%, a difference of 0.17%), and Immigrants from Guatemala (19.7%, a difference of 0.21%).
DemographicsRating | Rank3 or more Vehicles in Household
Thais
71.1
/100
|
#156
Good
19.8%
Hungarians
70.5
/100
|
#157
Good
19.8%
Armenians
68.8
/100
|
#158
Good
19.8%
Immigrants from Pakistan
68.2
/100
|
#159
Good
19.8%
Immigrants from Lebanon
67.6
/100
|
#160
Good
19.8%
Immigrants from Guatemala
65.6
/100
|
#161
Good
19.7%
Estonians
63.2
/100
|
#162
Good
19.7%
Chileans
63.0
/100
|
#163
Good
19.7%
Yugoslavians
62.9
/100
|
#164
Good
19.7%
Immigrants from Costa Rica
61.9
/100
|
#165
Good
19.7%
Immigrants from Cameroon
60.9
/100
|
#166
Good
19.7%
Ukrainians
58.9
/100
|
#167
Average
19.6%
Peruvians
58.8
/100
|
#168
Average
19.6%
Immigrants from Denmark
57.6
/100
|
#169
Average
19.6%
Iraqis
56.0
/100
|
#170
Average
19.6%

Chilean 3 or more Vehicles in Household Correlation Summary

MeasurementChilean Data3 or more Vehicles in Household Data
Minimum0.054%4.5%
Maximum24.5%44.4%
Range24.4%40.0%
Mean4.6%21.1%
Median3.2%19.8%
Interquartile 25% (IQ1)1.6%16.3%
Interquartile 75% (IQ3)5.5%23.4%
Interquartile Range (IQR)3.9%7.2%
Standard Deviation (Sample)4.9%8.2%
Standard Deviation (Population)4.9%8.1%

Correlation Details

Chilean PercentileSample Size3 or more Vehicles in Household
[
0.0%
-
0.5%
]
0.054%
182,366,45518.7%
[
0.0%
-
0.5%
]
0.17%
41,235,15719.8%
[
0.0%
-
0.5%
]
0.30%
15,232,25419.8%
[
0.0%
-
0.5%
]
0.42%
6,572,81121.4%
[
0.5%
-
1.0%
]
0.54%
3,911,55821.0%
[
0.5%
-
1.0%
]
0.67%
2,209,76418.4%
[
0.5%
-
1.0%
]
0.80%
1,583,32020.4%
[
0.5%
-
1.0%
]
0.92%
1,012,03522.0%
[
1.0%
-
1.5%
]
1.04%
670,25717.6%
[
1.0%
-
1.5%
]
1.16%
514,56722.4%
[
1.0%
-
1.5%
]
1.28%
334,37118.8%
[
1.0%
-
1.5%
]
1.40%
131,59322.2%
[
1.5%
-
2.0%
]
1.53%
93,56023.6%
[
1.5%
-
2.0%
]
1.66%
126,14225.4%
[
1.5%
-
2.0%
]
1.78%
87,51321.2%
[
1.5%
-
2.0%
]
1.88%
80,47017.9%
[
2.0%
-
2.5%
]
2.00%
35,88119.7%
[
2.0%
-
2.5%
]
2.15%
21,99212.7%
[
2.0%
-
2.5%
]
2.24%
40,47719.6%
[
2.0%
-
2.5%
]
2.40%
15,29912.1%
[
2.0%
-
2.5%
]
2.49%
10,11430.7%
[
2.5%
-
3.0%
]
2.62%
1,90713.4%
[
2.5%
-
3.0%
]
2.71%
14,63635.2%
[
2.5%
-
3.0%
]
2.93%
9,50311.2%
[
3.0%
-
3.5%
]
3.01%
19,16020.0%
[
3.0%
-
3.5%
]
3.07%
29,21118.1%
[
3.0%
-
3.5%
]
3.21%
8,10412.4%
[
3.0%
-
3.5%
]
3.35%
20,4488.4%
[
3.0%
-
3.5%
]
3.50%
2,57323.2%
[
3.5%
-
4.0%
]
3.64%
3,56722.1%
[
3.5%
-
4.0%
]
3.72%
3,03519.8%
[
3.5%
-
4.0%
]
3.98%
19,91719.8%
[
4.0%
-
4.5%
]
4.09%
27,41215.7%
[
4.0%
-
4.5%
]
4.26%
2,63136.8%
[
4.5%
-
5.0%
]
4.50%
3,62034.8%
[
4.5%
-
5.0%
]
4.60%
14,36113.3%
[
4.5%
-
5.0%
]
4.73%
3,74525.6%
[
4.5%
-
5.0%
]
4.80%
1,10417.9%
[
4.5%
-
5.0%
]
4.99%
1,02216.9%
[
5.0%
-
5.5%
]
5.40%
1,25930.2%
[
5.5%
-
6.0%
]
5.68%
3,94329.8%
[
5.5%
-
6.0%
]
5.99%
1,9044.5%
[
6.5%
-
7.0%
]
6.60%
98523.0%
[
6.5%
-
7.0%
]
6.64%
4,16920.4%
[
7.5%
-
8.0%
]
7.62%
8,45013.6%
[
7.5%
-
8.0%
]
7.95%
1,62232.8%
[
8.5%
-
9.0%
]
8.81%
7,30713.5%
[
9.0%
-
9.5%
]
9.49%
2,61211.9%
[
12.0%
-
12.5%
]
12.30%
73229.5%
[
14.0%
-
14.5%
]
14.06%
6444.4%
[
14.0%
-
14.5%
]
14.21%
95713.6%
[
21.0%
-
21.5%
]
21.27%
75743.4%
[
24.0%
-
24.5%
]
24.47%
9417.0%