Chilean Self-Care Disability
COMPARE
Chilean
Select to Compare
Self-Care Disability
Chilean Self-Care Disability
2.3%
SELF-CARE DISABILITY
98.8/ 100
METRIC RATING
80th/ 347
METRIC RANK
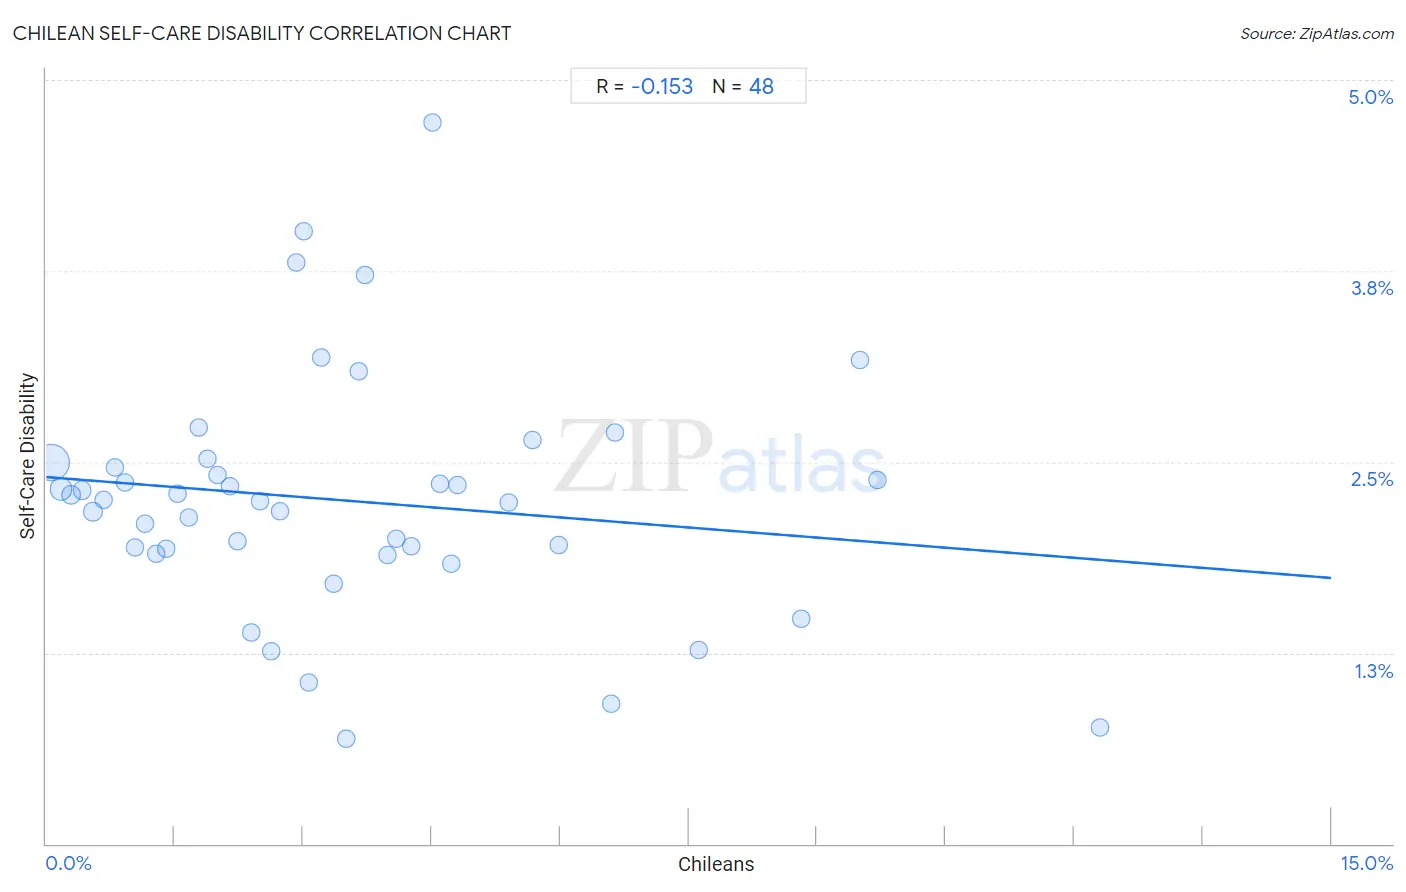
Chilean Self-Care Disability Correlation Chart
The statistical analysis conducted on geographies consisting of 256,527,062 people shows a poor negative correlation between the proportion of Chileans and percentage of population with self-care disability in the United States with a correlation coefficient (R) of -0.153 and weighted average of 2.3%. On average, for every 1% (one percent) increase in Chileans within a typical geography, there is a decrease of 0.044% in percentage of population with self-care disability.
It is essential to understand that the correlation between the percentage of Chileans and percentage of population with self-care disability does not imply a direct cause-and-effect relationship. It remains uncertain whether the presence of Chileans influences an upward or downward trend in the level of percentage of population with self-care disability within an area, or if Chileans simply ended up residing in those areas with higher or lower levels of percentage of population with self-care disability due to other factors.
Demographics Similar to Chileans by Self-Care Disability
In terms of self-care disability, the demographic groups most similar to Chileans are Ugandan (2.3%, a difference of 0.070%), Immigrants from Denmark (2.3%, a difference of 0.070%), Indian (Asian) (2.3%, a difference of 0.14%), Immigrants from Spain (2.3%, a difference of 0.17%), and Immigrants from Middle Africa (2.3%, a difference of 0.19%).
| Demographics | Rating | Rank | Self-Care Disability |
| Immigrants from Egypt | 99.1 /100 | #73 | Exceptional 2.3% |
| Immigrants from Switzerland | 99.1 /100 | #74 | Exceptional 2.3% |
| Immigrants from Netherlands | 99.1 /100 | #75 | Exceptional 2.3% |
| Immigrants from China | 99.1 /100 | #76 | Exceptional 2.3% |
| Immigrants from Middle Africa | 99.0 /100 | #77 | Exceptional 2.3% |
| Immigrants from Ireland | 99.0 /100 | #78 | Exceptional 2.3% |
| Immigrants from Kenya | 99.0 /100 | #79 | Exceptional 2.3% |
| Chileans | 98.8 /100 | #80 | Exceptional 2.3% |
| Ugandans | 98.8 /100 | #81 | Exceptional 2.3% |
| Immigrants from Denmark | 98.8 /100 | #82 | Exceptional 2.3% |
| Indians (Asian) | 98.7 /100 | #83 | Exceptional 2.3% |
| Immigrants from Spain | 98.7 /100 | #84 | Exceptional 2.3% |
| Estonians | 98.3 /100 | #85 | Exceptional 2.3% |
| Immigrants from Northern Africa | 98.2 /100 | #86 | Exceptional 2.3% |
| Sierra Leoneans | 98.0 /100 | #87 | Exceptional 2.4% |
Chilean Self-Care Disability Correlation Summary
| Measurement | Chilean Data | Self-Care Disability Data |
| Minimum | 0.054% | 0.69% |
| Maximum | 12.3% | 4.7% |
| Range | 12.2% | 4.0% |
| Mean | 3.5% | 2.2% |
| Median | 3.0% | 2.2% |
| Interquartile 25% (IQ1) | 1.5% | 1.9% |
| Interquartile 75% (IQ3) | 4.7% | 2.5% |
| Interquartile Range (IQR) | 3.2% | 0.57% |
| Standard Deviation (Sample) | 2.7% | 0.79% |
| Standard Deviation (Population) | 2.7% | 0.78% |
Correlation Details
| Chilean Percentile | Sample Size | Self-Care Disability |
[ 0.0% - 0.5% ] 0.054% | 182,381,016 | 2.5% |
[ 0.0% - 0.5% ] 0.17% | 41,248,841 | 2.3% |
[ 0.0% - 0.5% ] 0.30% | 15,240,483 | 2.3% |
[ 0.0% - 0.5% ] 0.42% | 6,581,644 | 2.3% |
[ 0.5% - 1.0% ] 0.54% | 3,912,126 | 2.2% |
[ 0.5% - 1.0% ] 0.66% | 2,205,763 | 2.2% |
[ 0.5% - 1.0% ] 0.80% | 1,584,417 | 2.5% |
[ 0.5% - 1.0% ] 0.92% | 1,010,098 | 2.4% |
[ 1.0% - 1.5% ] 1.04% | 665,795 | 1.9% |
[ 1.0% - 1.5% ] 1.16% | 505,297 | 2.1% |
[ 1.0% - 1.5% ] 1.28% | 334,371 | 1.9% |
[ 1.0% - 1.5% ] 1.40% | 130,631 | 1.9% |
[ 1.5% - 2.0% ] 1.53% | 93,560 | 2.3% |
[ 1.5% - 2.0% ] 1.66% | 125,359 | 2.1% |
[ 1.5% - 2.0% ] 1.79% | 87,046 | 2.7% |
[ 1.5% - 2.0% ] 1.88% | 80,470 | 2.5% |
[ 2.0% - 2.5% ] 2.00% | 35,486 | 2.4% |
[ 2.0% - 2.5% ] 2.15% | 21,992 | 2.3% |
[ 2.0% - 2.5% ] 2.24% | 40,477 | 2.0% |
[ 2.0% - 2.5% ] 2.40% | 15,299 | 1.4% |
[ 2.0% - 2.5% ] 2.49% | 10,114 | 2.2% |
[ 2.5% - 3.0% ] 2.62% | 1,907 | 1.3% |
[ 2.5% - 3.0% ] 2.72% | 16,418 | 2.2% |
[ 2.5% - 3.0% ] 2.93% | 9,503 | 3.8% |
[ 3.0% - 3.5% ] 3.01% | 19,160 | 4.0% |
[ 3.0% - 3.5% ] 3.07% | 29,211 | 1.1% |
[ 3.0% - 3.5% ] 3.21% | 8,104 | 3.2% |
[ 3.0% - 3.5% ] 3.35% | 20,448 | 1.7% |
[ 3.0% - 3.5% ] 3.50% | 2,573 | 0.69% |
[ 3.5% - 4.0% ] 3.65% | 1,975 | 3.1% |
[ 3.5% - 4.0% ] 3.72% | 3,035 | 3.7% |
[ 3.5% - 4.0% ] 3.98% | 19,917 | 1.9% |
[ 4.0% - 4.5% ] 4.08% | 26,881 | 2.0% |
[ 4.0% - 4.5% ] 4.26% | 2,631 | 2.0% |
[ 4.5% - 5.0% ] 4.50% | 3,620 | 4.7% |
[ 4.5% - 5.0% ] 4.60% | 14,361 | 2.4% |
[ 4.5% - 5.0% ] 4.73% | 3,745 | 1.8% |
[ 4.5% - 5.0% ] 4.80% | 917 | 2.4% |
[ 5.0% - 5.5% ] 5.40% | 537 | 2.2% |
[ 5.5% - 6.0% ] 5.68% | 3,943 | 2.6% |
[ 5.5% - 6.0% ] 5.99% | 1,904 | 2.0% |
[ 6.5% - 7.0% ] 6.60% | 985 | 0.91% |
[ 6.5% - 7.0% ] 6.64% | 4,169 | 2.7% |
[ 7.5% - 8.0% ] 7.62% | 8,450 | 1.3% |
[ 8.5% - 9.0% ] 8.81% | 7,307 | 1.5% |
[ 9.0% - 9.5% ] 9.49% | 2,612 | 3.2% |
[ 9.5% - 10.0% ] 9.70% | 1,732 | 2.4% |
[ 12.0% - 12.5% ] 12.30% | 732 | 0.76% |