Argentinean Unemployment Among Women with Children Ages 6 to 17 years

COMPARE

Argentinean
Race
Ancestry
AfghanAfricanAlaska NativeAlaskan AthabascanAlbanianAleutAlsatianAmericanApacheArabArapahoArgentineanArmenianAssyrian/Chaldean/SyriacAustralianAustrianBahamianBangladeshiBarbadianBasqueBelgianBelizeanBermudanBhutaneseBlackfeetBolivianBrazilianBritishBritish West IndianBulgarianBurmeseCajunCambodianCanadianCape VerdeanCarpatho RusynCelticCentral AmericanCentral American IndianCherokeeCheyenneChickasawChileanChineseChippewaChoctawColombianColvilleComancheCosta RicanCreeCreekCroatianCrowCubanCypriotCzechCzechoslovakianDanishDelawareDominicanDutchDutch West IndianEastern EuropeanEcuadorianEgyptianEnglishEstonianEthiopianEuropeanFijianFilipinoFinnishFrenchFrench American IndianFrench CanadianGermanGerman RussianGhanaianGreekGuamanian/ChamorroGuatemalanGuyaneseHaitianHmongHonduranHopiHoumaHungarianIcelanderIndian (Asian)IndonesianInupiatIranianIraqiIrishIroquoisIsraeliItalianJamaicanJapaneseJordanianKenyanKiowaKoreanLaotianLatvianLebaneseLiberianLithuanianLumbeeLuxembourgerMacedonianMalaysianMalteseMarshalleseMenomineeMexicanMexican American IndianMongolianMoroccanNative HawaiianNavajoNepaleseNew ZealanderNicaraguanNigerianNorthern EuropeanNorwegianOkinawanOsageOttawaPaiutePakistaniPalestinianPanamanianParaguayanPennsylvania GermanPeruvianPimaPolishPortuguesePotawatomiPuebloPuerto RicanPuget Sound SalishRomanianRussianSalvadoranSamoanScandinavianScotch-IrishScottishSeminoleSenegaleseSerbianShoshoneSierra LeoneanSiouxSlavicSlovakSloveneSomaliSouth AfricanSouth AmericanSouth American IndianSoviet UnionSpaniardSpanishSpanish AmericanSpanish American IndianSri LankanSubsaharan AfricanSudaneseSwedishSwissSyrianTaiwaneseThaiTlingit-HaidaTohono O'OdhamTonganTrinidadian and TobagonianTsimshianTurkishU.S. Virgin IslanderUgandanUkrainianUruguayanUteVenezuelanVietnameseWelshWest IndianYakamaYaquiYugoslavianYumanYup'ikZimbabwean
Immigration
NonimmigrantsImmigrantsAfghanistanAfricaAlbaniaArgentinaArmeniaAsiaAustraliaAustriaBahamasBangladeshBarbadosBelarusBelgiumBelizeBoliviaBosnia and HerzegovinaBrazilBulgariaBurma/MyanmarCabo VerdeCambodiaCameroonCanadaCaribbeanCentral AmericaChileChinaColombiaCongoCosta RicaCroatiaCubaCzechoslovakiaDenmarkDominicaDominican RepublicEastern AfricaEastern AsiaEastern EuropeEcuadorEgyptEl SalvadorEnglandEritreaEthiopiaEuropeFijiFranceGermanyGhanaGreeceGrenadaGuatemalaGuyanaHaitiHondurasHong KongHungaryIndiaIndonesiaIranIraqIrelandIsraelItalyJamaicaJapanJordanKazakhstanKenyaKoreaKuwaitLaosLatin AmericaLatviaLebanonLiberiaLithuaniaMalaysiaMexicoMicronesiaMiddle AfricaMoldovaMoroccoNepalNetherlandsNicaraguaNigeriaNorth AmericaNorth MacedoniaNorthern AfricaNorthern EuropeNorwayOceaniaPakistanPanamaPeruPhilippinesPolandPortugalRomaniaRussiaSaudi ArabiaScotlandSenegalSerbiaSierra LeoneSingaporeSomaliaSouth AfricaSouth AmericaSouth Central AsiaSouth Eastern AsiaSouthern EuropeSpainSri LankaSt. Vincent and the GrenadinesSudanSwedenSwitzerlandSyriaTaiwanThailandTrinidad and TobagoTurkeyUgandaUkraineUruguayUzbekistanVenezuelaVietnamWest IndiesWestern AfricaWestern AsiaWestern EuropeYemenZaireZimbabweAzores
Select to Compare
Race
Ancestry
AfghanAfricanAlaska NativeAlaskan AthabascanAlbanianAleutAlsatianAmericanApacheArabArapahoArmenianAssyrian/Chaldean/SyriacAustralianAustrianBahamianBangladeshiBarbadianBasqueBelgianBelizeanBermudanBhutaneseBlackfeetBolivianBrazilianBritishBritish West IndianBulgarianBurmeseCajunCambodianCanadianCape VerdeanCarpatho RusynCelticCentral AmericanCentral American IndianCherokeeCheyenneChickasawChileanChineseChippewaChoctawColombianColvilleComancheCosta RicanCreeCreekCroatianCrowCubanCypriotCzechCzechoslovakianDanishDelawareDominicanDutchDutch West IndianEastern EuropeanEcuadorianEgyptianEnglishEstonianEthiopianEuropeanFijianFilipinoFinnishFrenchFrench American IndianFrench CanadianGermanGerman RussianGhanaianGreekGuamanian/ChamorroGuatemalanGuyaneseHaitianHmongHonduranHopiHoumaHungarianIcelanderIndian (Asian)IndonesianInupiatIranianIraqiIrishIroquoisIsraeliItalianJamaicanJapaneseJordanianKenyanKiowaKoreanLaotianLatvianLebaneseLiberianLithuanianLumbeeLuxembourgerMacedonianMalaysianMalteseMarshalleseMenomineeMexicanMexican American IndianMongolianMoroccanNative HawaiianNavajoNepaleseNew ZealanderNicaraguanNigerianNorthern EuropeanNorwegianOkinawanOsageOttawaPaiutePakistaniPalestinianPanamanianParaguayanPennsylvania GermanPeruvianPimaPolishPortuguesePotawatomiPuebloPuerto RicanPuget Sound SalishRomanianRussianSalvadoranSamoanScandinavianScotch-IrishScottishSeminoleSenegaleseSerbianShoshoneSierra LeoneanSiouxSlavicSlovakSloveneSomaliSouth AfricanSouth AmericanSouth American IndianSoviet UnionSpaniardSpanishSpanish AmericanSpanish American IndianSri LankanSubsaharan AfricanSudaneseSwedishSwissSyrianTaiwaneseThaiTlingit-HaidaTohono O'OdhamTonganTrinidadian and TobagonianTsimshianTurkishU.S. Virgin IslanderUgandanUkrainianUruguayanUteVenezuelanVietnameseWelshWest IndianYakamaYaquiYugoslavianYumanYup'ikZimbabwean
Immigration
NonimmigrantsImmigrantsAfghanistanAfricaAlbaniaArgentinaArmeniaAsiaAustraliaAustriaBahamasBangladeshBarbadosBelarusBelgiumBelizeBoliviaBosnia and HerzegovinaBrazilBulgariaBurma/MyanmarCabo VerdeCambodiaCameroonCanadaCaribbeanCentral AmericaChileChinaColombiaCongoCosta RicaCroatiaCubaCzechoslovakiaDenmarkDominicaDominican RepublicEastern AfricaEastern AsiaEastern EuropeEcuadorEgyptEl SalvadorEnglandEritreaEthiopiaEuropeFijiFranceGermanyGhanaGreeceGrenadaGuatemalaGuyanaHaitiHondurasHong KongHungaryIndiaIndonesiaIranIraqIrelandIsraelItalyJamaicaJapanJordanKazakhstanKenyaKoreaKuwaitLaosLatin AmericaLatviaLebanonLiberiaLithuaniaMalaysiaMexicoMicronesiaMiddle AfricaMoldovaMoroccoNepalNetherlandsNicaraguaNigeriaNorth AmericaNorth MacedoniaNorthern AfricaNorthern EuropeNorwayOceaniaPakistanPanamaPeruPhilippinesPolandPortugalRomaniaRussiaSaudi ArabiaScotlandSenegalSerbiaSierra LeoneSingaporeSomaliaSouth AfricaSouth AmericaSouth Central AsiaSouth Eastern AsiaSouthern EuropeSpainSri LankaSt. Vincent and the GrenadinesSudanSwedenSwitzerlandSyriaTaiwanThailandTrinidad and TobagoTurkeyUgandaUkraineUruguayUzbekistanVenezuelaVietnamWest IndiesWestern AfricaWestern AsiaWestern EuropeYemenZaireZimbabweAzores
Unemployment Among Women with Children Ages 6 to 17 years
Income
Poverty
Unemployment
Labor Participation
Family Structure
Vehicle Availability
Education Level
Disability

Argentinean Unemployment Among Women with Children Ages 6 to 17 years
Exceptional

8.6%
UNEMPLOYMENT | WOMEN W/ CHILDREN 6 TO 17
96.5/ 100
METRIC RATING
115th/ 347
METRIC RANK

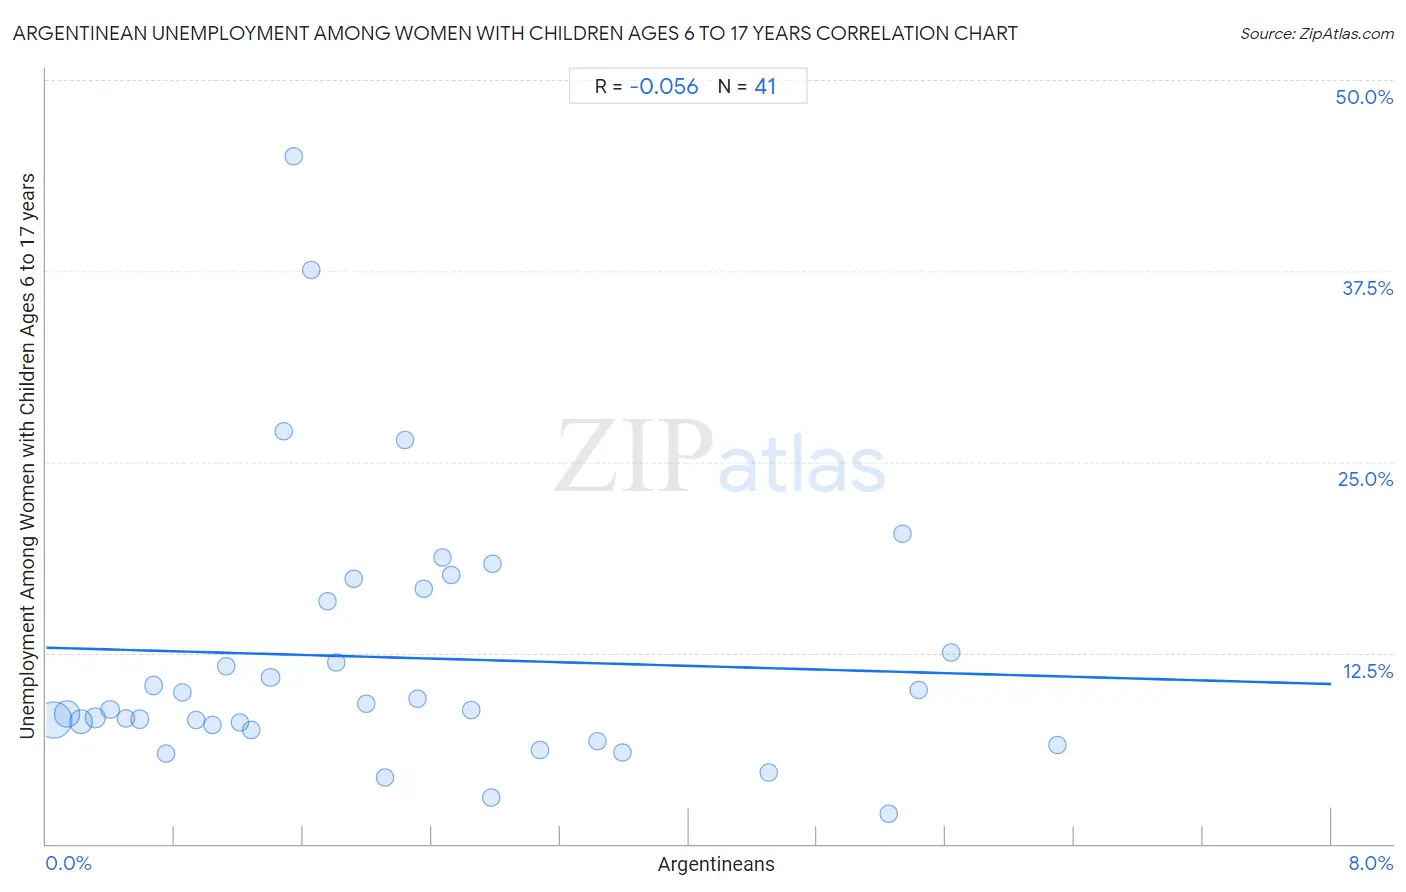
Argentinean Unemployment Among Women with Children Ages 6 to 17 years Correlation Chart

The statistical analysis conducted on geographies consisting of 227,377,871 people shows a slight negative correlation between the proportion of Argentineans and unemployment rate among women with children between the ages 6 and 17 in the United States with a correlation coefficient (R) of -0.056 and weighted average of 8.6%. On average, for every 1% (one percent) increase in Argentineans within a typical geography, there is a decrease of 0.30% in unemployment rate among women with children between the ages 6 and 17.
Argentinean Unemployment Among Women with Children Ages 6 to 17 years
It is essential to understand that the correlation between the percentage of Argentineans and unemployment rate among women with children between the ages 6 and 17 does not imply a direct cause-and-effect relationship. It remains uncertain whether the presence of Argentineans influences an upward or downward trend in the level of unemployment rate among women with children between the ages 6 and 17 within an area, or if Argentineans simply ended up residing in those areas with higher or lower levels of unemployment rate among women with children between the ages 6 and 17 due to other factors.

Demographics Similar to Argentineans by Unemployment Among Women with Children Ages 6 to 17 years

In terms of unemployment among women with children ages 6 to 17 years, the demographic groups most similar to Argentineans are Immigrants from Russia (8.6%, a difference of 0.070%), Zimbabwean (8.6%, a difference of 0.070%), Eastern European (8.6%, a difference of 0.080%), Albanian (8.6%, a difference of 0.080%), and Pueblo (8.6%, a difference of 0.11%).
DemographicsRating | RankUnemployment Among Women with Children Ages 6 to 17 years
Swedes
97.6
/100
|
#108
Exceptional
8.6%
Immigrants from Romania
97.5
/100
|
#109
Exceptional
8.6%
Latvians
97.4
/100
|
#110
Exceptional
8.6%
Immigrants from Ukraine
97.4
/100
|
#111
Exceptional
8.6%
Romanians
97.1
/100
|
#112
Exceptional
8.6%
Eastern Europeans
96.8
/100
|
#113
Exceptional
8.6%
Immigrants from Russia
96.7
/100
|
#114
Exceptional
8.6%
Argentineans
96.5
/100
|
#115
Exceptional
8.6%
Zimbabweans
96.3
/100
|
#116
Exceptional
8.6%
Albanians
96.3
/100
|
#117
Exceptional
8.6%
Pueblo
96.2
/100
|
#118
Exceptional
8.6%
Immigrants from Grenada
96.2
/100
|
#119
Exceptional
8.6%
Israelis
95.9
/100
|
#120
Exceptional
8.7%
Immigrants from Denmark
95.5
/100
|
#121
Exceptional
8.7%
Immigrants from Egypt
95.0
/100
|
#122
Exceptional
8.7%

Argentinean Unemployment Among Women with Children Ages 6 to 17 years Correlation Summary

MeasurementArgentinean DataUnemployment Among Women with Children Ages 6 to 17 years Data
Minimum0.045%2.0%
Maximum6.3%45.0%
Range6.2%43.0%
Mean2.2%12.2%
Median1.8%8.8%
Interquartile 25% (IQ1)0.89%7.6%
Interquartile 75% (IQ3)2.8%16.3%
Interquartile Range (IQR)1.9%8.6%
Standard Deviation (Sample)1.6%8.8%
Standard Deviation (Population)1.6%8.7%

Correlation Details

Argentinean PercentileSample SizeUnemployment Among Women with Children Ages 6 to 17 years
[
0.0%
-
0.5%
]
0.045%
113,310,9088.1%
[
0.0%
-
0.5%
]
0.13%
50,126,0098.5%
[
0.0%
-
0.5%
]
0.22%
31,913,5608.0%
[
0.0%
-
0.5%
]
0.31%
11,211,5498.3%
[
0.0%
-
0.5%
]
0.40%
6,070,0398.8%
[
0.0%
-
0.5%
]
0.50%
3,794,1298.2%
[
0.5%
-
1.0%
]
0.58%
2,703,1588.2%
[
0.5%
-
1.0%
]
0.67%
1,600,78910.4%
[
0.5%
-
1.0%
]
0.75%
1,727,1325.9%
[
0.5%
-
1.0%
]
0.85%
854,0699.9%
[
0.5%
-
1.0%
]
0.94%
619,7138.1%
[
1.0%
-
1.5%
]
1.03%
581,6487.8%
[
1.0%
-
1.5%
]
1.12%
303,70611.7%
[
1.0%
-
1.5%
]
1.21%
611,1757.9%
[
1.0%
-
1.5%
]
1.28%
285,7277.5%
[
1.0%
-
1.5%
]
1.40%
685,24010.9%
[
1.0%
-
1.5%
]
1.48%
49,00227.0%
[
1.5%
-
2.0%
]
1.54%
67,78245.0%
[
1.5%
-
2.0%
]
1.65%
95,96337.6%
[
1.5%
-
2.0%
]
1.75%
23,89815.9%
[
1.5%
-
2.0%
]
1.80%
111,11211.9%
[
1.5%
-
2.0%
]
1.91%
52,90917.3%
[
1.5%
-
2.0%
]
2.00%
163,9959.2%
[
2.0%
-
2.5%
]
2.11%
38,3904.3%
[
2.0%
-
2.5%
]
2.23%
25,28326.4%
[
2.0%
-
2.5%
]
2.32%
13,2619.5%
[
2.0%
-
2.5%
]
2.35%
2,64116.7%
[
2.0%
-
2.5%
]
2.47%
33,20618.7%
[
2.5%
-
3.0%
]
2.52%
5,22817.6%
[
2.5%
-
3.0%
]
2.65%
44,4068.7%
[
2.5%
-
3.0%
]
2.77%
26,8143.0%
[
2.5%
-
3.0%
]
2.78%
6,91118.3%
[
3.0%
-
3.5%
]
3.07%
48,1966.1%
[
3.0%
-
3.5%
]
3.43%
31,5646.7%
[
3.5%
-
4.0%
]
3.59%
16,8546.0%
[
4.0%
-
4.5%
]
4.49%
1,4244.7%
[
5.0%
-
5.5%
]
5.24%
82,4002.0%
[
5.0%
-
5.5%
]
5.33%
4,97220.3%
[
5.0%
-
5.5%
]
5.43%
11,63810.1%
[
5.5%
-
6.0%
]
5.63%
1,68612.5%
[
6.0%
-
6.5%
]
6.29%
19,7856.5%