Argentinean Self-Care Disability
COMPARE
Argentinean
Select to Compare
Self-Care Disability
Argentinean Self-Care Disability
2.3%
SELF-CARE DISABILITY
99.6/ 100
METRIC RATING
54th/ 347
METRIC RANK
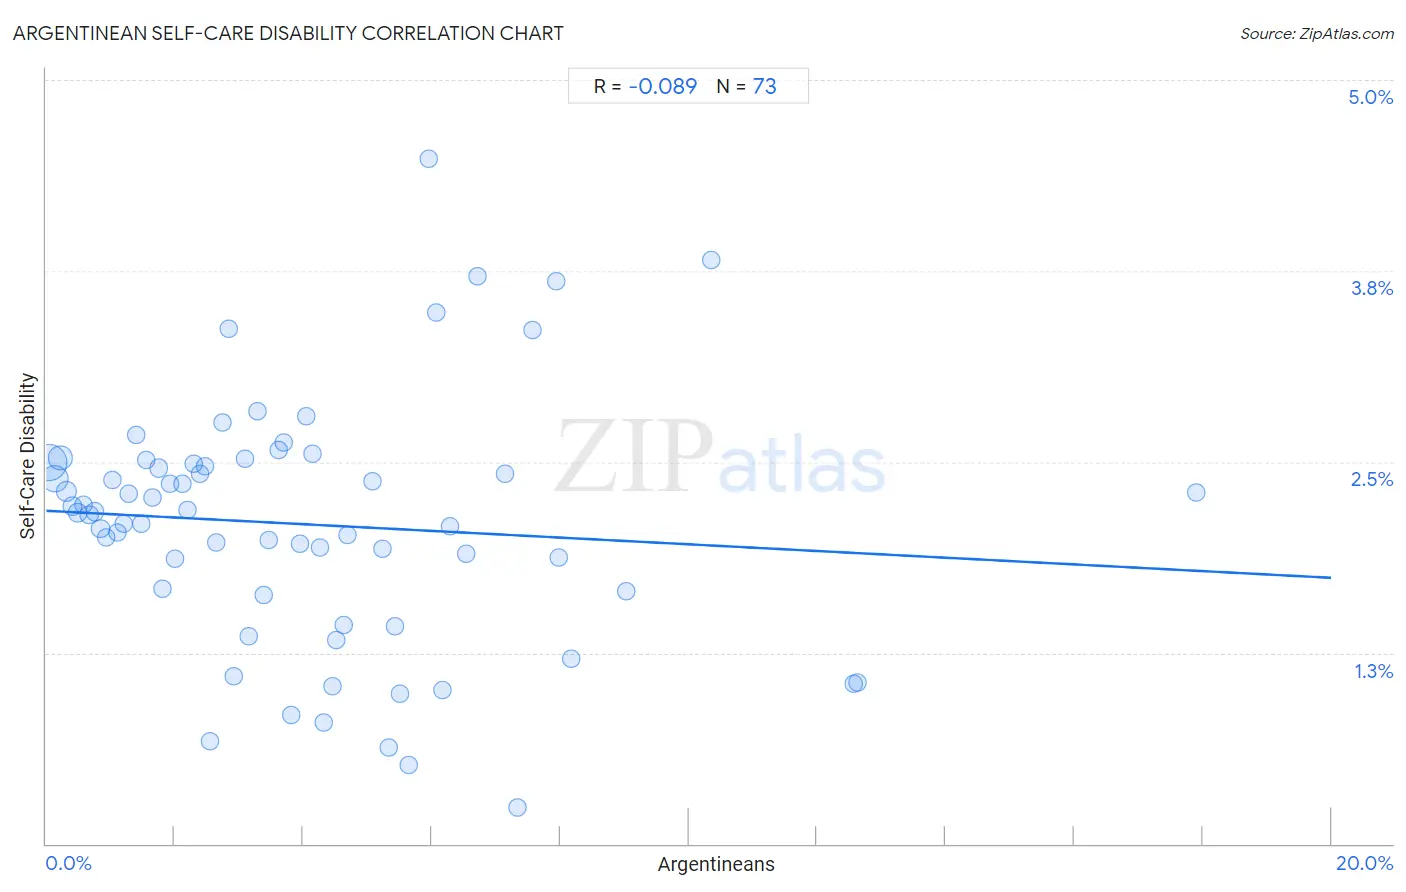
Argentinean Self-Care Disability Correlation Chart
The statistical analysis conducted on geographies consisting of 296,904,932 people shows a slight negative correlation between the proportion of Argentineans and percentage of population with self-care disability in the United States with a correlation coefficient (R) of -0.089 and weighted average of 2.3%. On average, for every 1% (one percent) increase in Argentineans within a typical geography, there is a decrease of 0.022% in percentage of population with self-care disability.
It is essential to understand that the correlation between the percentage of Argentineans and percentage of population with self-care disability does not imply a direct cause-and-effect relationship. It remains uncertain whether the presence of Argentineans influences an upward or downward trend in the level of percentage of population with self-care disability within an area, or if Argentineans simply ended up residing in those areas with higher or lower levels of percentage of population with self-care disability due to other factors.
Demographics Similar to Argentineans by Self-Care Disability
In terms of self-care disability, the demographic groups most similar to Argentineans are Australian (2.3%, a difference of 0.050%), Immigrants from France (2.3%, a difference of 0.060%), Immigrants from Serbia (2.3%, a difference of 0.080%), Kenyan (2.3%, a difference of 0.10%), and Immigrants from Eastern Asia (2.3%, a difference of 0.10%).
| Demographics | Rating | Rank | Self-Care Disability |
| Jordanians | 99.7 /100 | #47 | Exceptional 2.3% |
| Immigrants from Malaysia | 99.7 /100 | #48 | Exceptional 2.3% |
| Latvians | 99.7 /100 | #49 | Exceptional 2.3% |
| Immigrants from Brazil | 99.7 /100 | #50 | Exceptional 2.3% |
| Kenyans | 99.7 /100 | #51 | Exceptional 2.3% |
| Immigrants from Serbia | 99.6 /100 | #52 | Exceptional 2.3% |
| Australians | 99.6 /100 | #53 | Exceptional 2.3% |
| Argentineans | 99.6 /100 | #54 | Exceptional 2.3% |
| Immigrants from France | 99.6 /100 | #55 | Exceptional 2.3% |
| Immigrants from Eastern Asia | 99.6 /100 | #56 | Exceptional 2.3% |
| Immigrants from Belgium | 99.6 /100 | #57 | Exceptional 2.3% |
| Immigrants from Cameroon | 99.6 /100 | #58 | Exceptional 2.3% |
| New Zealanders | 99.5 /100 | #59 | Exceptional 2.3% |
| Immigrants from Japan | 99.5 /100 | #60 | Exceptional 2.3% |
| Palestinians | 99.4 /100 | #61 | Exceptional 2.3% |
Argentinean Self-Care Disability Correlation Summary
| Measurement | Argentinean Data | Self-Care Disability Data |
| Minimum | 0.045% | 0.24% |
| Maximum | 17.9% | 4.5% |
| Range | 17.9% | 4.2% |
| Mean | 4.0% | 2.1% |
| Median | 3.4% | 2.2% |
| Interquartile 25% (IQ1) | 1.6% | 1.6% |
| Interquartile 75% (IQ3) | 5.6% | 2.5% |
| Interquartile Range (IQR) | 4.0% | 0.85% |
| Standard Deviation (Sample) | 3.3% | 0.81% |
| Standard Deviation (Population) | 3.3% | 0.80% |
Correlation Details
| Argentinean Percentile | Sample Size | Self-Care Disability |
[ 0.0% - 0.5% ] 0.045% | 139,445,019 | 2.5% |
[ 0.0% - 0.5% ] 0.13% | 65,091,408 | 2.4% |
[ 0.0% - 0.5% ] 0.22% | 40,710,010 | 2.5% |
[ 0.0% - 0.5% ] 0.31% | 16,496,288 | 2.3% |
[ 0.0% - 0.5% ] 0.40% | 9,994,550 | 2.2% |
[ 0.0% - 0.5% ] 0.50% | 6,282,060 | 2.2% |
[ 0.5% - 1.0% ] 0.58% | 4,134,872 | 2.2% |
[ 0.5% - 1.0% ] 0.67% | 3,026,192 | 2.2% |
[ 0.5% - 1.0% ] 0.75% | 2,564,548 | 2.2% |
[ 0.5% - 1.0% ] 0.85% | 1,338,043 | 2.1% |
[ 0.5% - 1.0% ] 0.93% | 1,061,466 | 2.0% |
[ 1.0% - 1.5% ] 1.03% | 966,925 | 2.4% |
[ 1.0% - 1.5% ] 1.11% | 677,441 | 2.0% |
[ 1.0% - 1.5% ] 1.20% | 993,065 | 2.1% |
[ 1.0% - 1.5% ] 1.29% | 555,584 | 2.3% |
[ 1.0% - 1.5% ] 1.40% | 867,610 | 2.7% |
[ 1.0% - 1.5% ] 1.48% | 267,037 | 2.1% |
[ 1.5% - 2.0% ] 1.56% | 205,493 | 2.5% |
[ 1.5% - 2.0% ] 1.64% | 178,750 | 2.3% |
[ 1.5% - 2.0% ] 1.76% | 241,358 | 2.5% |
[ 1.5% - 2.0% ] 1.81% | 146,505 | 1.7% |
[ 1.5% - 2.0% ] 1.93% | 135,496 | 2.4% |
[ 1.5% - 2.0% ] 2.00% | 201,321 | 1.9% |
[ 2.0% - 2.5% ] 2.12% | 92,693 | 2.4% |
[ 2.0% - 2.5% ] 2.19% | 99,225 | 2.2% |
[ 2.0% - 2.5% ] 2.29% | 61,444 | 2.5% |
[ 2.0% - 2.5% ] 2.39% | 29,185 | 2.4% |
[ 2.0% - 2.5% ] 2.46% | 96,652 | 2.5% |
[ 2.5% - 3.0% ] 2.55% | 30,528 | 0.67% |
[ 2.5% - 3.0% ] 2.65% | 76,015 | 2.0% |
[ 2.5% - 3.0% ] 2.75% | 59,884 | 2.8% |
[ 2.5% - 3.0% ] 2.84% | 47,793 | 3.4% |
[ 2.5% - 3.0% ] 2.92% | 16,342 | 1.1% |
[ 3.0% - 3.5% ] 3.09% | 93,687 | 2.5% |
[ 3.0% - 3.5% ] 3.16% | 23,405 | 1.4% |
[ 3.0% - 3.5% ] 3.28% | 1,067 | 2.8% |
[ 3.0% - 3.5% ] 3.38% | 74,653 | 1.6% |
[ 3.0% - 3.5% ] 3.46% | 73,622 | 2.0% |
[ 3.5% - 4.0% ] 3.62% | 57,196 | 2.6% |
[ 3.5% - 4.0% ] 3.70% | 10,721 | 2.6% |
[ 3.5% - 4.0% ] 3.80% | 6,651 | 0.84% |
[ 3.5% - 4.0% ] 3.95% | 12,081 | 2.0% |
[ 4.0% - 4.5% ] 4.04% | 1,360 | 2.8% |
[ 4.0% - 4.5% ] 4.15% | 289 | 2.6% |
[ 4.0% - 4.5% ] 4.26% | 24,163 | 1.9% |
[ 4.0% - 4.5% ] 4.32% | 19,563 | 0.79% |
[ 4.0% - 4.5% ] 4.46% | 13,255 | 1.0% |
[ 4.5% - 5.0% ] 4.51% | 6,225 | 1.3% |
[ 4.5% - 5.0% ] 4.63% | 23,734 | 1.4% |
[ 4.5% - 5.0% ] 4.68% | 33,282 | 2.0% |
[ 5.0% - 5.5% ] 5.07% | 2,683 | 2.4% |
[ 5.0% - 5.5% ] 5.24% | 98,850 | 1.9% |
[ 5.0% - 5.5% ] 5.33% | 7,792 | 0.63% |
[ 5.0% - 5.5% ] 5.43% | 11,638 | 1.4% |
[ 5.5% - 6.0% ] 5.51% | 7,388 | 0.98% |
[ 5.5% - 6.0% ] 5.63% | 1,686 | 0.52% |
[ 5.5% - 6.0% ] 5.95% | 605 | 4.5% |
[ 6.0% - 6.5% ] 6.06% | 1,237 | 3.5% |
[ 6.0% - 6.5% ] 6.18% | 6,590 | 1.0% |
[ 6.0% - 6.5% ] 6.29% | 19,785 | 2.1% |
[ 6.5% - 7.0% ] 6.54% | 35,967 | 1.9% |
[ 6.5% - 7.0% ] 6.71% | 1,013 | 3.7% |
[ 7.0% - 7.5% ] 7.15% | 5,290 | 2.4% |
[ 7.0% - 7.5% ] 7.33% | 887 | 0.24% |
[ 7.5% - 8.0% ] 7.56% | 238 | 3.4% |
[ 7.5% - 8.0% ] 7.94% | 3,174 | 3.7% |
[ 7.5% - 8.0% ] 7.98% | 689 | 1.9% |
[ 8.0% - 8.5% ] 8.17% | 1,041 | 1.2% |
[ 9.0% - 9.5% ] 9.02% | 2,461 | 1.7% |
[ 10.0% - 10.5% ] 10.36% | 560 | 3.8% |
[ 12.5% - 13.0% ] 12.57% | 14,639 | 1.1% |
[ 12.5% - 13.0% ] 12.63% | 14,572 | 1.1% |
[ 17.5% - 18.0% ] 17.90% | 391 | 2.3% |