Argentinean Married-couple Households
COMPARE
Argentinean
Select to Compare
Married-couple Households
Argentinean Married-couple Households
47.5%
MARRIED-COUPLE HOUSEHOLDS
92.5/ 100
METRIC RATING
116th/ 347
METRIC RANK
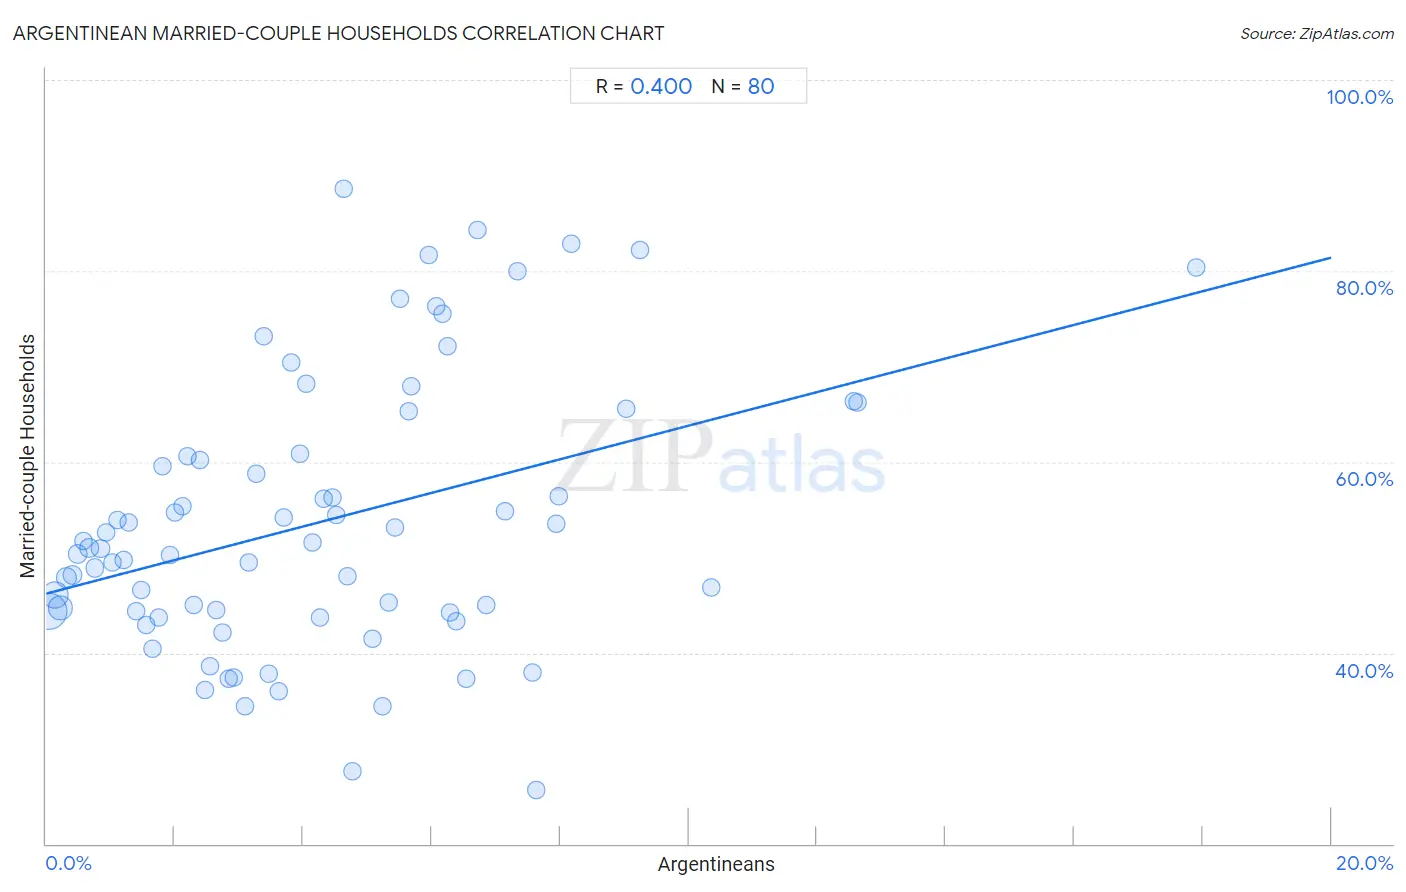
Argentinean Married-couple Households Correlation Chart
The statistical analysis conducted on geographies consisting of 296,995,795 people shows a mild positive correlation between the proportion of Argentineans and percentage of married-couple family households in the United States with a correlation coefficient (R) of 0.400 and weighted average of 47.5%. On average, for every 1% (one percent) increase in Argentineans within a typical geography, there is an increase of 1.8% in percentage of married-couple family households.
It is essential to understand that the correlation between the percentage of Argentineans and percentage of married-couple family households does not imply a direct cause-and-effect relationship. It remains uncertain whether the presence of Argentineans influences an upward or downward trend in the level of percentage of married-couple family households within an area, or if Argentineans simply ended up residing in those areas with higher or lower levels of percentage of married-couple family households due to other factors.
Demographics Similar to Argentineans by Married-couple Households
In terms of married-couple households, the demographic groups most similar to Argentineans are French Canadian (47.5%, a difference of 0.010%), Immigrants from Germany (47.5%, a difference of 0.020%), Slovak (47.6%, a difference of 0.050%), Chilean (47.5%, a difference of 0.050%), and Immigrants from Europe (47.6%, a difference of 0.17%).
| Demographics | Rating | Rank | Married-couple Households |
| Immigrants from Jordan | 94.1 /100 | #109 | Exceptional 47.7% |
| Macedonians | 93.9 /100 | #110 | Exceptional 47.6% |
| Syrians | 93.9 /100 | #111 | Exceptional 47.6% |
| Peruvians | 93.8 /100 | #112 | Exceptional 47.6% |
| Venezuelans | 93.8 /100 | #113 | Exceptional 47.6% |
| Immigrants from Europe | 93.7 /100 | #114 | Exceptional 47.6% |
| Slovaks | 92.9 /100 | #115 | Exceptional 47.6% |
| Argentineans | 92.5 /100 | #116 | Exceptional 47.5% |
| French Canadians | 92.4 /100 | #117 | Exceptional 47.5% |
| Immigrants from Germany | 92.4 /100 | #118 | Exceptional 47.5% |
| Chileans | 92.2 /100 | #119 | Exceptional 47.5% |
| Puget Sound Salish | 90.5 /100 | #120 | Exceptional 47.4% |
| Immigrants from Eastern Europe | 90.3 /100 | #121 | Exceptional 47.4% |
| Okinawans | 90.1 /100 | #122 | Exceptional 47.4% |
| Immigrants from Venezuela | 89.3 /100 | #123 | Excellent 47.4% |
Argentinean Married-couple Households Correlation Summary
| Measurement | Argentinean Data | Married-couple Households Data |
| Minimum | 0.045% | 25.6% |
| Maximum | 17.9% | 88.5% |
| Range | 17.9% | 62.9% |
| Mean | 4.3% | 53.7% |
| Median | 3.8% | 51.0% |
| Interquartile 25% (IQ1) | 1.8% | 44.3% |
| Interquartile 75% (IQ3) | 6.1% | 60.7% |
| Interquartile Range (IQR) | 4.3% | 16.4% |
| Standard Deviation (Sample) | 3.2% | 14.3% |
| Standard Deviation (Population) | 3.2% | 14.2% |
Correlation Details
| Argentinean Percentile | Sample Size | Married-couple Households |
[ 0.0% - 0.5% ] 0.045% | 139,462,953 | 44.3% |
[ 0.0% - 0.5% ] 0.13% | 65,079,604 | 46.1% |
[ 0.0% - 0.5% ] 0.22% | 40,700,114 | 44.7% |
[ 0.0% - 0.5% ] 0.31% | 16,509,492 | 47.9% |
[ 0.0% - 0.5% ] 0.40% | 9,999,909 | 48.1% |
[ 0.0% - 0.5% ] 0.50% | 6,289,006 | 50.4% |
[ 0.5% - 1.0% ] 0.58% | 4,136,871 | 51.7% |
[ 0.5% - 1.0% ] 0.67% | 3,032,340 | 51.0% |
[ 0.5% - 1.0% ] 0.75% | 2,575,657 | 48.9% |
[ 0.5% - 1.0% ] 0.85% | 1,341,177 | 50.9% |
[ 0.5% - 1.0% ] 0.93% | 1,061,466 | 52.6% |
[ 1.0% - 1.5% ] 1.03% | 968,111 | 49.4% |
[ 1.0% - 1.5% ] 1.11% | 677,441 | 53.9% |
[ 1.0% - 1.5% ] 1.20% | 993,577 | 49.8% |
[ 1.0% - 1.5% ] 1.29% | 555,584 | 53.7% |
[ 1.0% - 1.5% ] 1.40% | 877,928 | 44.4% |
[ 1.0% - 1.5% ] 1.48% | 267,037 | 46.6% |
[ 1.5% - 2.0% ] 1.56% | 212,348 | 43.0% |
[ 1.5% - 2.0% ] 1.64% | 180,007 | 40.4% |
[ 1.5% - 2.0% ] 1.76% | 241,358 | 43.7% |
[ 1.5% - 2.0% ] 1.81% | 154,011 | 59.5% |
[ 1.5% - 2.0% ] 1.93% | 135,496 | 50.2% |
[ 1.5% - 2.0% ] 2.00% | 201,906 | 54.7% |
[ 2.0% - 2.5% ] 2.12% | 92,977 | 55.3% |
[ 2.0% - 2.5% ] 2.19% | 101,823 | 60.6% |
[ 2.0% - 2.5% ] 2.29% | 61,444 | 45.0% |
[ 2.0% - 2.5% ] 2.39% | 33,303 | 60.2% |
[ 2.0% - 2.5% ] 2.46% | 96,652 | 36.1% |
[ 2.5% - 3.0% ] 2.55% | 30,528 | 38.7% |
[ 2.5% - 3.0% ] 2.65% | 76,703 | 44.5% |
[ 2.5% - 3.0% ] 2.75% | 59,884 | 42.1% |
[ 2.5% - 3.0% ] 2.84% | 47,793 | 37.3% |
[ 2.5% - 3.0% ] 2.92% | 16,342 | 37.4% |
[ 3.0% - 3.5% ] 3.09% | 93,687 | 34.4% |
[ 3.0% - 3.5% ] 3.16% | 23,405 | 49.4% |
[ 3.0% - 3.5% ] 3.26% | 2,207 | 58.8% |
[ 3.0% - 3.5% ] 3.38% | 74,653 | 73.2% |
[ 3.0% - 3.5% ] 3.46% | 73,622 | 37.8% |
[ 3.5% - 4.0% ] 3.62% | 57,196 | 36.0% |
[ 3.5% - 4.0% ] 3.70% | 10,989 | 54.1% |
[ 3.5% - 4.0% ] 3.80% | 6,651 | 70.4% |
[ 3.5% - 4.0% ] 3.95% | 12,579 | 60.9% |
[ 4.0% - 4.5% ] 4.04% | 1,360 | 68.1% |
[ 4.0% - 4.5% ] 4.15% | 289 | 51.6% |
[ 4.0% - 4.5% ] 4.26% | 24,163 | 43.7% |
[ 4.0% - 4.5% ] 4.33% | 19,907 | 56.1% |
[ 4.0% - 4.5% ] 4.46% | 13,255 | 56.3% |
[ 4.5% - 5.0% ] 4.51% | 6,225 | 54.5% |
[ 4.5% - 5.0% ] 4.63% | 23,734 | 88.5% |
[ 4.5% - 5.0% ] 4.68% | 33,282 | 48.0% |
[ 4.5% - 5.0% ] 4.76% | 1,994 | 27.6% |
[ 5.0% - 5.5% ] 5.07% | 2,683 | 41.5% |
[ 5.0% - 5.5% ] 5.24% | 98,850 | 34.4% |
[ 5.0% - 5.5% ] 5.33% | 7,792 | 45.2% |
[ 5.0% - 5.5% ] 5.43% | 11,638 | 53.2% |
[ 5.5% - 6.0% ] 5.51% | 7,388 | 77.0% |
[ 5.5% - 6.0% ] 5.63% | 1,917 | 65.3% |
[ 5.5% - 6.0% ] 5.68% | 88 | 67.9% |
[ 5.5% - 6.0% ] 5.95% | 605 | 81.7% |
[ 6.0% - 6.5% ] 6.06% | 1,237 | 76.4% |
[ 6.0% - 6.5% ] 6.18% | 6,590 | 75.5% |
[ 6.0% - 6.5% ] 6.24% | 593 | 72.2% |
[ 6.0% - 6.5% ] 6.29% | 19,785 | 44.2% |
[ 6.0% - 6.5% ] 6.37% | 1,381 | 43.3% |
[ 6.5% - 7.0% ] 6.54% | 35,967 | 37.3% |
[ 6.5% - 7.0% ] 6.71% | 1,013 | 84.3% |
[ 6.5% - 7.0% ] 6.85% | 3,589 | 45.1% |
[ 7.0% - 7.5% ] 7.15% | 5,290 | 54.8% |
[ 7.0% - 7.5% ] 7.33% | 887 | 80.0% |
[ 7.5% - 8.0% ] 7.56% | 238 | 38.0% |
[ 7.5% - 8.0% ] 7.62% | 210 | 25.6% |
[ 7.5% - 8.0% ] 7.94% | 3,098 | 53.5% |
[ 7.5% - 8.0% ] 7.98% | 689 | 56.3% |
[ 8.0% - 8.5% ] 8.17% | 1,041 | 82.9% |
[ 9.0% - 9.5% ] 9.02% | 2,461 | 65.6% |
[ 9.0% - 9.5% ] 9.24% | 563 | 82.2% |
[ 10.0% - 10.5% ] 10.36% | 560 | 46.9% |
[ 12.5% - 13.0% ] 12.57% | 14,639 | 66.3% |
[ 12.5% - 13.0% ] 12.63% | 14,572 | 66.2% |
[ 17.5% - 18.0% ] 17.90% | 391 | 80.3% |