Argentinean vs Nicaraguan Disability Age 5 to 17
COMPARE
Argentinean
Nicaraguan
Disability Age 5 to 17
Disability Age 5 to 17 Comparison
Argentineans
Nicaraguans
5.1%
DISABILITY AGE 5 TO 17
99.9/ 100
METRIC RATING
50th/ 347
METRIC RANK
5.3%
DISABILITY AGE 5 TO 17
98.6/ 100
METRIC RATING
102nd/ 347
METRIC RANK
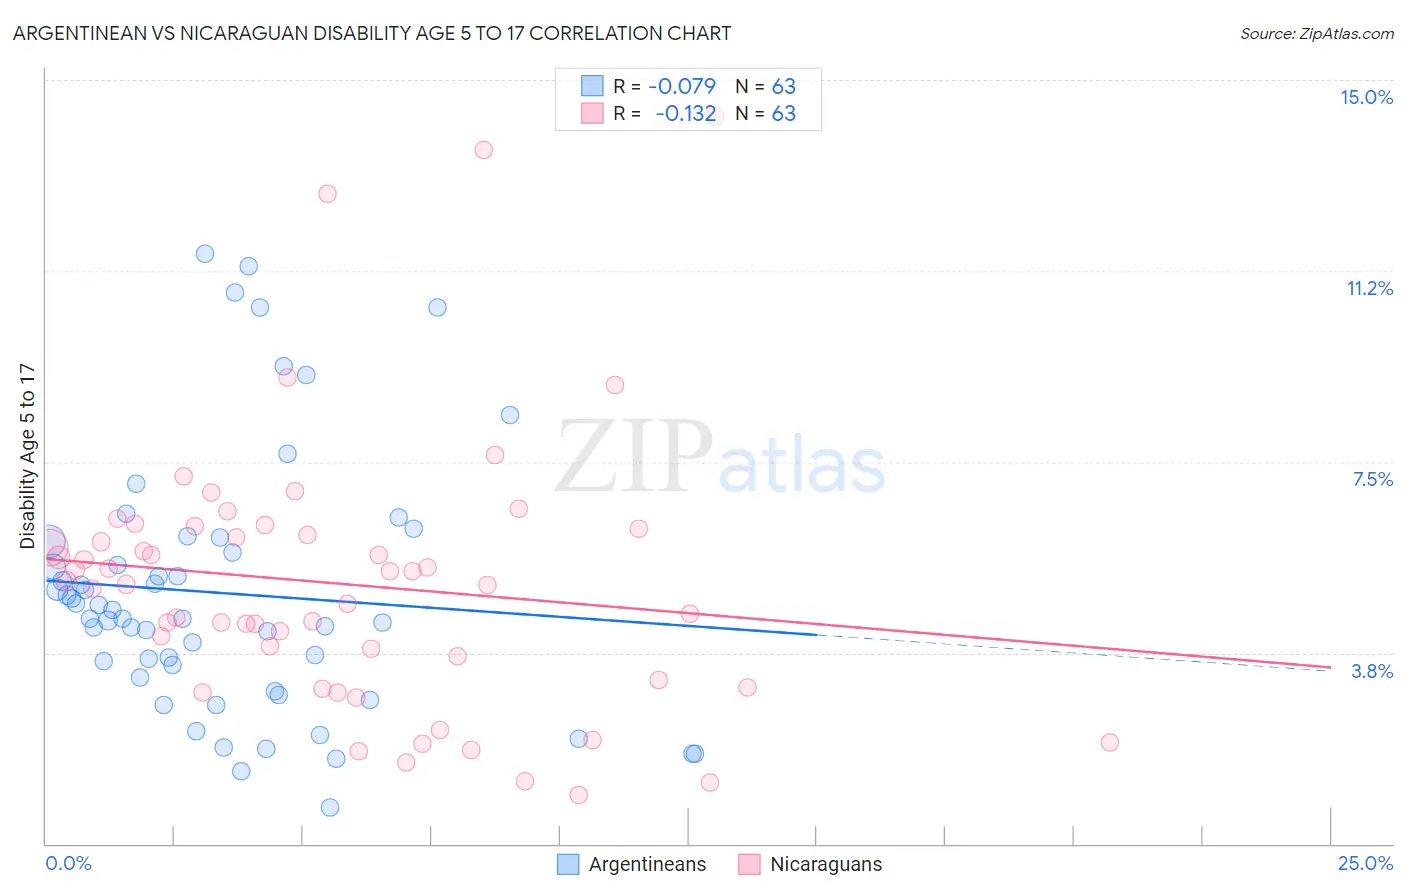
Argentinean vs Nicaraguan Disability Age 5 to 17 Correlation Chart
The statistical analysis conducted on geographies consisting of 295,397,898 people shows a slight negative correlation between the proportion of Argentineans and percentage of population with a disability between the ages 5 and 17 in the United States with a correlation coefficient (R) of -0.079 and weighted average of 5.1%. Similarly, the statistical analysis conducted on geographies consisting of 284,558,915 people shows a poor negative correlation between the proportion of Nicaraguans and percentage of population with a disability between the ages 5 and 17 in the United States with a correlation coefficient (R) of -0.132 and weighted average of 5.3%, a difference of 4.3%.
Disability Age 5 to 17 Correlation Summary
| Measurement | Argentinean | Nicaraguan |
| Minimum | 0.71% | 0.96% |
| Maximum | 11.6% | 14.3% |
| Range | 10.9% | 13.3% |
| Mean | 4.9% | 5.1% |
| Median | 4.4% | 5.1% |
| Interquartile 25% (IQ1) | 3.3% | 3.2% |
| Interquartile 75% (IQ3) | 5.9% | 6.2% |
| Interquartile Range (IQR) | 2.7% | 3.0% |
| Standard Deviation (Sample) | 2.5% | 2.7% |
| Standard Deviation (Population) | 2.5% | 2.6% |
Similar Demographics by Disability Age 5 to 17
Demographics Similar to Argentineans by Disability Age 5 to 17
In terms of disability age 5 to 17, the demographic groups most similar to Argentineans are Turkish (5.1%, a difference of 0.29%), Immigrants from Fiji (5.1%, a difference of 0.38%), Immigrants from Western Asia (5.1%, a difference of 0.41%), Immigrants from Lithuania (5.1%, a difference of 0.44%), and Paraguayan (5.1%, a difference of 0.47%).
| Demographics | Rating | Rank | Disability Age 5 to 17 |
| Immigrants | Russia | 100.0 /100 | #43 | Exceptional 5.0% |
| Egyptians | 100.0 /100 | #44 | Exceptional 5.0% |
| Tongans | 100.0 /100 | #45 | Exceptional 5.0% |
| Assyrians/Chaldeans/Syriacs | 100.0 /100 | #46 | Exceptional 5.0% |
| Vietnamese | 100.0 /100 | #47 | Exceptional 5.1% |
| Koreans | 100.0 /100 | #48 | Exceptional 5.1% |
| Immigrants | Western Asia | 100.0 /100 | #49 | Exceptional 5.1% |
| Argentineans | 99.9 /100 | #50 | Exceptional 5.1% |
| Turks | 99.9 /100 | #51 | Exceptional 5.1% |
| Immigrants | Fiji | 99.9 /100 | #52 | Exceptional 5.1% |
| Immigrants | Lithuania | 99.9 /100 | #53 | Exceptional 5.1% |
| Paraguayans | 99.9 /100 | #54 | Exceptional 5.1% |
| Laotians | 99.9 /100 | #55 | Exceptional 5.1% |
| Immigrants | Turkey | 99.9 /100 | #56 | Exceptional 5.1% |
| Immigrants | Poland | 99.9 /100 | #57 | Exceptional 5.1% |
Demographics Similar to Nicaraguans by Disability Age 5 to 17
In terms of disability age 5 to 17, the demographic groups most similar to Nicaraguans are Salvadoran (5.3%, a difference of 0.030%), Menominee (5.3%, a difference of 0.080%), Nepalese (5.3%, a difference of 0.10%), Peruvian (5.3%, a difference of 0.10%), and Immigrants from Italy (5.3%, a difference of 0.19%).
| Demographics | Rating | Rank | Disability Age 5 to 17 |
| Immigrants | Grenada | 99.1 /100 | #95 | Exceptional 5.3% |
| Immigrants | El Salvador | 99.0 /100 | #96 | Exceptional 5.3% |
| Immigrants | Europe | 99.0 /100 | #97 | Exceptional 5.3% |
| Immigrants | Austria | 98.9 /100 | #98 | Exceptional 5.3% |
| Cambodians | 98.8 /100 | #99 | Exceptional 5.3% |
| Nepalese | 98.7 /100 | #100 | Exceptional 5.3% |
| Menominee | 98.7 /100 | #101 | Exceptional 5.3% |
| Nicaraguans | 98.6 /100 | #102 | Exceptional 5.3% |
| Salvadorans | 98.6 /100 | #103 | Exceptional 5.3% |
| Peruvians | 98.5 /100 | #104 | Exceptional 5.3% |
| Immigrants | Italy | 98.4 /100 | #105 | Exceptional 5.3% |
| Immigrants | Yemen | 98.2 /100 | #106 | Exceptional 5.3% |
| Russians | 98.2 /100 | #107 | Exceptional 5.3% |
| Immigrants | South Africa | 98.1 /100 | #108 | Exceptional 5.3% |
| Immigrants | Northern Africa | 98.1 /100 | #109 | Exceptional 5.3% |