Argentinean Married-Couple Family Poverty
COMPARE
Argentinean
Select to Compare
Married-Couple Family Poverty
Argentinean Married-Couple Family Poverty
5.1%
POVERTY | MARRIED-COUPLE FAMILIES
70.7/ 100
METRIC RATING
157th/ 347
METRIC RANK
Argentinean Married-Couple Family Poverty Correlation Chart
The statistical analysis conducted on geographies consisting of 295,403,165 people shows a weak positive correlation between the proportion of Argentineans and poverty level among married-couple families in the United States with a correlation coefficient (R) of 0.217 and weighted average of 5.1%. On average, for every 1% (one percent) increase in Argentineans within a typical geography, there is an increase of 0.24% in poverty level among married-couple families.
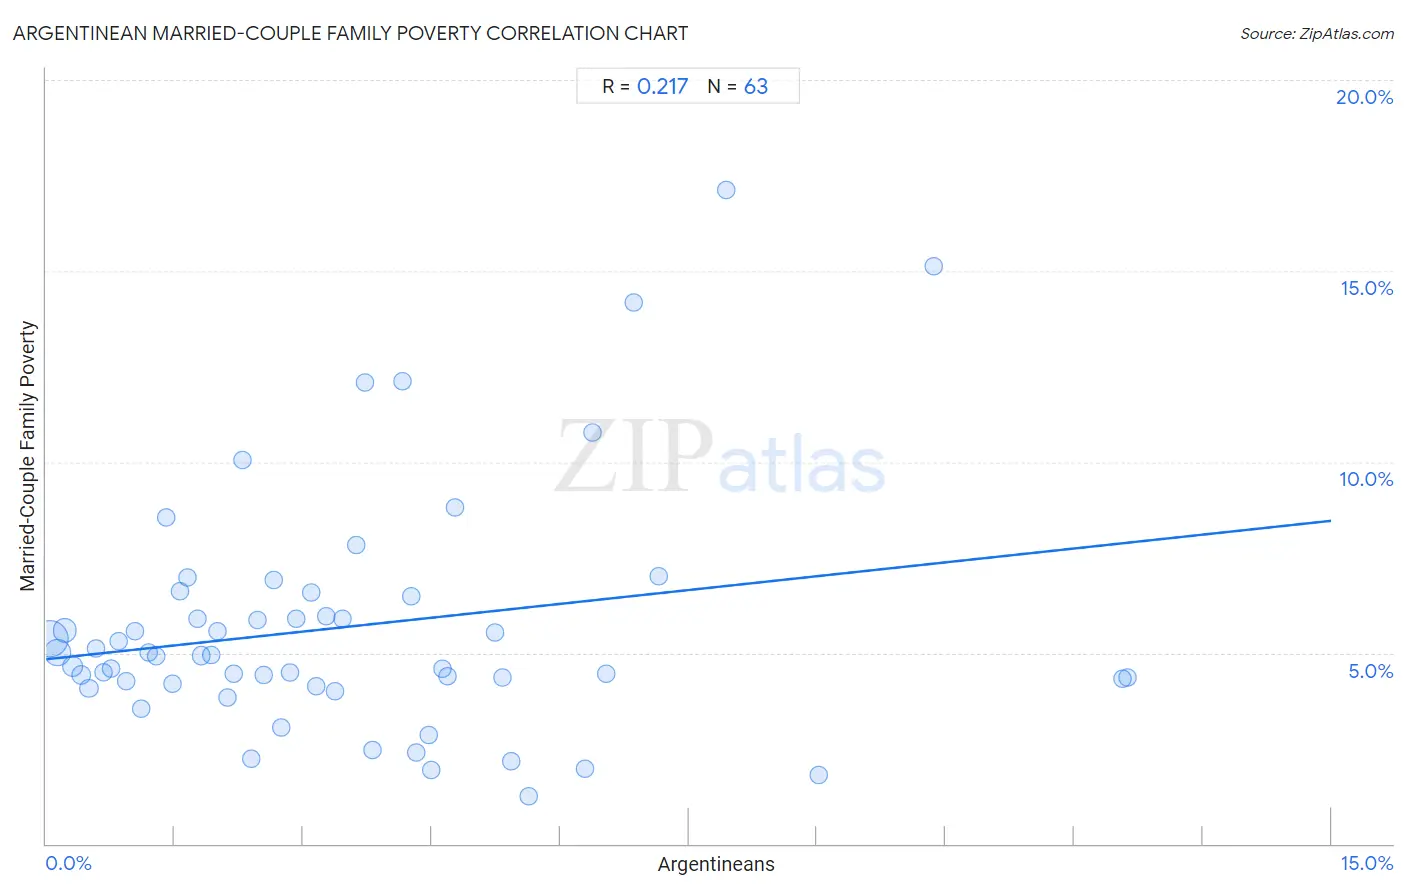
It is essential to understand that the correlation between the percentage of Argentineans and poverty level among married-couple families does not imply a direct cause-and-effect relationship. It remains uncertain whether the presence of Argentineans influences an upward or downward trend in the level of poverty level among married-couple families within an area, or if Argentineans simply ended up residing in those areas with higher or lower levels of poverty level among married-couple families due to other factors.
Demographics Similar to Argentineans by Married-Couple Family Poverty
In terms of married-couple family poverty, the demographic groups most similar to Argentineans are Immigrants from South Eastern Asia (5.1%, a difference of 0.050%), Immigrants from Saudi Arabia (5.1%, a difference of 0.050%), Sri Lankan (5.1%, a difference of 0.22%), Immigrants from Ethiopia (5.1%, a difference of 0.26%), and Pennsylvania German (5.1%, a difference of 0.30%).
| Demographics | Rating | Rank | Married-Couple Family Poverty |
| Brazilians | 78.3 /100 | #150 | Good 5.0% |
| Immigrants from Cameroon | 77.3 /100 | #151 | Good 5.0% |
| Albanians | 77.2 /100 | #152 | Good 5.0% |
| Immigrants from Kuwait | 76.3 /100 | #153 | Good 5.0% |
| Delaware | 73.7 /100 | #154 | Good 5.1% |
| Immigrants from Ethiopia | 72.4 /100 | #155 | Good 5.1% |
| Sri Lankans | 72.2 /100 | #156 | Good 5.1% |
| Argentineans | 70.7 /100 | #157 | Good 5.1% |
| Immigrants from South Eastern Asia | 70.4 /100 | #158 | Good 5.1% |
| Immigrants from Saudi Arabia | 70.3 /100 | #159 | Good 5.1% |
| Pennsylvania Germans | 68.5 /100 | #160 | Good 5.1% |
| Ethiopians | 68.1 /100 | #161 | Good 5.1% |
| Immigrants from Jordan | 66.5 /100 | #162 | Good 5.1% |
| Sierra Leoneans | 64.1 /100 | #163 | Good 5.1% |
| Hawaiians | 62.3 /100 | #164 | Good 5.1% |
Argentinean Married-Couple Family Poverty Correlation Summary
| Measurement | Argentinean Data | Married-Couple Family Poverty Data |
| Minimum | 0.045% | 1.2% |
| Maximum | 12.6% | 17.1% |
| Range | 12.6% | 15.9% |
| Mean | 3.5% | 5.7% |
| Median | 2.8% | 4.9% |
| Interquartile 25% (IQ1) | 1.4% | 4.2% |
| Interquartile 75% (IQ3) | 4.7% | 6.5% |
| Interquartile Range (IQR) | 3.3% | 2.3% |
| Standard Deviation (Sample) | 2.8% | 3.2% |
| Standard Deviation (Population) | 2.8% | 3.1% |
Correlation Details
| Argentinean Percentile | Sample Size | Married-Couple Family Poverty |
[ 0.0% - 0.5% ] 0.045% | 139,247,028 | 5.4% |
[ 0.0% - 0.5% ] 0.13% | 64,693,964 | 5.0% |
[ 0.0% - 0.5% ] 0.22% | 40,518,466 | 5.6% |
[ 0.0% - 0.5% ] 0.31% | 16,374,624 | 4.7% |
[ 0.0% - 0.5% ] 0.40% | 9,911,313 | 4.4% |
[ 0.0% - 0.5% ] 0.50% | 6,221,748 | 4.1% |
[ 0.5% - 1.0% ] 0.58% | 4,034,596 | 5.1% |
[ 0.5% - 1.0% ] 0.67% | 2,963,561 | 4.5% |
[ 0.5% - 1.0% ] 0.75% | 2,546,870 | 4.6% |
[ 0.5% - 1.0% ] 0.84% | 1,292,081 | 5.3% |
[ 0.5% - 1.0% ] 0.93% | 1,051,086 | 4.3% |
[ 1.0% - 1.5% ] 1.03% | 914,540 | 5.6% |
[ 1.0% - 1.5% ] 1.11% | 672,474 | 3.5% |
[ 1.0% - 1.5% ] 1.20% | 977,673 | 5.0% |
[ 1.0% - 1.5% ] 1.29% | 523,626 | 4.9% |
[ 1.0% - 1.5% ] 1.40% | 863,394 | 8.6% |
[ 1.0% - 1.5% ] 1.48% | 255,034 | 4.2% |
[ 1.5% - 2.0% ] 1.56% | 198,506 | 6.6% |
[ 1.5% - 2.0% ] 1.64% | 170,968 | 7.0% |
[ 1.5% - 2.0% ] 1.76% | 239,503 | 5.9% |
[ 1.5% - 2.0% ] 1.81% | 153,300 | 4.9% |
[ 1.5% - 2.0% ] 1.93% | 132,504 | 5.0% |
[ 1.5% - 2.0% ] 2.00% | 201,321 | 5.6% |
[ 2.0% - 2.5% ] 2.12% | 78,008 | 3.8% |
[ 2.0% - 2.5% ] 2.19% | 91,227 | 4.5% |
[ 2.0% - 2.5% ] 2.29% | 60,293 | 10.1% |
[ 2.0% - 2.5% ] 2.39% | 24,731 | 2.2% |
[ 2.0% - 2.5% ] 2.46% | 96,611 | 5.9% |
[ 2.5% - 3.0% ] 2.55% | 29,980 | 4.4% |
[ 2.5% - 3.0% ] 2.65% | 75,439 | 6.9% |
[ 2.5% - 3.0% ] 2.75% | 59,884 | 3.1% |
[ 2.5% - 3.0% ] 2.85% | 41,411 | 4.5% |
[ 2.5% - 3.0% ] 2.92% | 15,184 | 5.9% |
[ 3.0% - 3.5% ] 3.09% | 93,110 | 6.6% |
[ 3.0% - 3.5% ] 3.16% | 21,771 | 4.1% |
[ 3.0% - 3.5% ] 3.26% | 1,686 | 6.0% |
[ 3.0% - 3.5% ] 3.38% | 74,653 | 4.0% |
[ 3.0% - 3.5% ] 3.46% | 73,622 | 5.9% |
[ 3.5% - 4.0% ] 3.62% | 57,196 | 7.8% |
[ 3.5% - 4.0% ] 3.72% | 5,937 | 12.1% |
[ 3.5% - 4.0% ] 3.80% | 6,651 | 2.4% |
[ 4.0% - 4.5% ] 4.15% | 289 | 12.1% |
[ 4.0% - 4.5% ] 4.26% | 24,163 | 6.5% |
[ 4.0% - 4.5% ] 4.32% | 19,426 | 2.4% |
[ 4.0% - 4.5% ] 4.46% | 13,255 | 2.8% |
[ 4.0% - 4.5% ] 4.49% | 1,424 | 1.9% |
[ 4.5% - 5.0% ] 4.63% | 23,734 | 4.6% |
[ 4.5% - 5.0% ] 4.68% | 32,881 | 4.4% |
[ 4.5% - 5.0% ] 4.76% | 1,994 | 8.8% |
[ 5.0% - 5.5% ] 5.24% | 98,850 | 5.5% |
[ 5.0% - 5.5% ] 5.33% | 7,792 | 4.3% |
[ 5.0% - 5.5% ] 5.43% | 11,638 | 2.2% |
[ 5.5% - 6.0% ] 5.63% | 1,686 | 1.2% |
[ 6.0% - 6.5% ] 6.29% | 19,785 | 2.0% |
[ 6.0% - 6.5% ] 6.37% | 1,381 | 10.8% |
[ 6.5% - 7.0% ] 6.54% | 35,967 | 4.5% |
[ 6.5% - 7.0% ] 6.85% | 3,589 | 14.2% |
[ 7.0% - 7.5% ] 7.15% | 4,407 | 7.0% |
[ 7.5% - 8.0% ] 7.94% | 3,098 | 17.1% |
[ 9.0% - 9.5% ] 9.02% | 2,461 | 1.8% |
[ 10.0% - 10.5% ] 10.36% | 560 | 15.1% |
[ 12.5% - 13.0% ] 12.57% | 14,639 | 4.3% |
[ 12.5% - 13.0% ] 12.63% | 14,572 | 4.3% |