Argentinean 4 or more Vehicles in Household
COMPARE
Argentinean
Select to Compare
4 or more Vehicles in Household
Argentinean 4 or more Vehicles in Household
6.2%
4+ VEHICLES AVAILABLE
27.0/ 100
METRIC RATING
195th/ 347
METRIC RANK
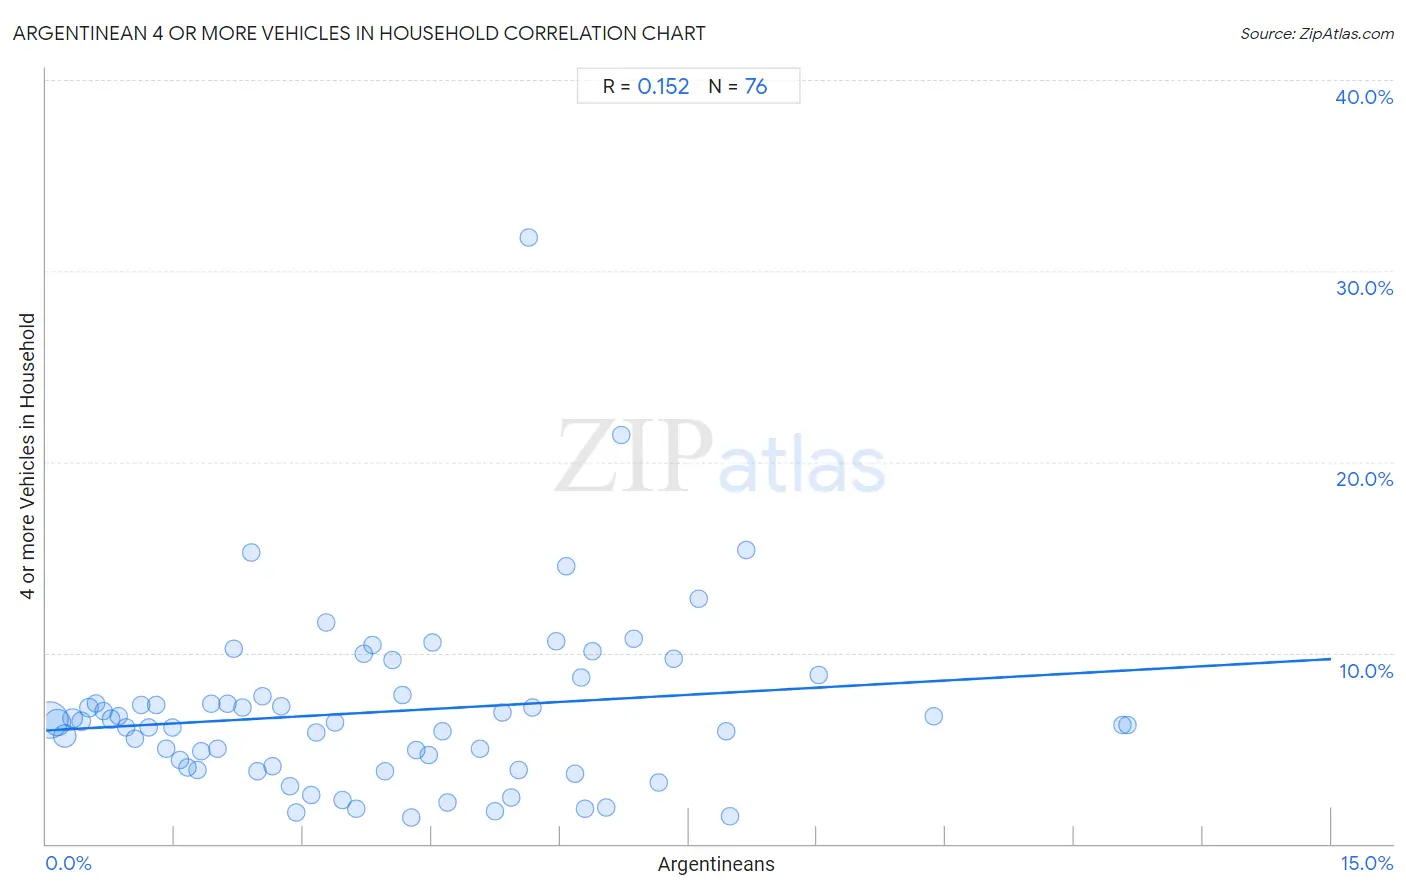
Argentinean 4 or more Vehicles in Household Correlation Chart
The statistical analysis conducted on geographies consisting of 295,773,782 people shows a poor positive correlation between the proportion of Argentineans and percentage of households with 4 or more vehicles available in the United States with a correlation coefficient (R) of 0.152 and weighted average of 6.2%. On average, for every 1% (one percent) increase in Argentineans within a typical geography, there is an increase of 0.25% in percentage of households with 4 or more vehicles available.
It is essential to understand that the correlation between the percentage of Argentineans and percentage of households with 4 or more vehicles available does not imply a direct cause-and-effect relationship. It remains uncertain whether the presence of Argentineans influences an upward or downward trend in the level of percentage of households with 4 or more vehicles available within an area, or if Argentineans simply ended up residing in those areas with higher or lower levels of percentage of households with 4 or more vehicles available due to other factors.
Demographics Similar to Argentineans by 4 or more Vehicles in Household
In terms of 4 or more vehicles in household, the demographic groups most similar to Argentineans are Immigrants from Sweden (6.2%, a difference of 0.0%), Tsimshian (6.2%, a difference of 0.070%), Immigrants from Kuwait (6.2%, a difference of 0.13%), Immigrants from Sri Lanka (6.1%, a difference of 0.45%), and Romanian (6.2%, a difference of 0.47%).
| Demographics | Rating | Rank | 4 or more Vehicles in Household |
| Kiowa | 34.7 /100 | #188 | Fair 6.2% |
| Immigrants from Eastern Asia | 33.3 /100 | #189 | Fair 6.2% |
| South Africans | 32.2 /100 | #190 | Fair 6.2% |
| Inupiat | 30.7 /100 | #191 | Fair 6.2% |
| Romanians | 30.7 /100 | #192 | Fair 6.2% |
| Immigrants from Kuwait | 28.0 /100 | #193 | Fair 6.2% |
| Immigrants from Sweden | 27.0 /100 | #194 | Fair 6.2% |
| Argentineans | 27.0 /100 | #195 | Fair 6.2% |
| Tsimshian | 26.4 /100 | #196 | Fair 6.2% |
| Immigrants from Sri Lanka | 23.7 /100 | #197 | Fair 6.1% |
| Immigrants from Portugal | 22.3 /100 | #198 | Fair 6.1% |
| Immigrants from Norway | 21.8 /100 | #199 | Fair 6.1% |
| Latvians | 21.7 /100 | #200 | Fair 6.1% |
| Egyptians | 21.4 /100 | #201 | Fair 6.1% |
| Immigrants from South Central Asia | 21.3 /100 | #202 | Fair 6.1% |
Argentinean 4 or more Vehicles in Household Correlation Summary
| Measurement | Argentinean Data | 4 or more Vehicles in Household Data |
| Minimum | 0.045% | 1.3% |
| Maximum | 12.6% | 31.8% |
| Range | 12.6% | 30.4% |
| Mean | 4.0% | 6.9% |
| Median | 3.5% | 6.3% |
| Interquartile 25% (IQ1) | 1.7% | 4.0% |
| Interquartile 75% (IQ3) | 5.8% | 7.8% |
| Interquartile Range (IQR) | 4.1% | 3.7% |
| Standard Deviation (Sample) | 2.8% | 4.6% |
| Standard Deviation (Population) | 2.8% | 4.6% |
Correlation Details
| Argentinean Percentile | Sample Size | 4 or more Vehicles in Household |
[ 0.0% - 0.5% ] 0.045% | 139,116,759 | 6.5% |
[ 0.0% - 0.5% ] 0.13% | 64,891,716 | 6.4% |
[ 0.0% - 0.5% ] 0.22% | 40,598,852 | 5.6% |
[ 0.0% - 0.5% ] 0.31% | 16,420,011 | 6.6% |
[ 0.0% - 0.5% ] 0.40% | 9,923,238 | 6.4% |
[ 0.0% - 0.5% ] 0.50% | 6,246,044 | 7.1% |
[ 0.5% - 1.0% ] 0.58% | 4,108,734 | 7.3% |
[ 0.5% - 1.0% ] 0.67% | 2,863,004 | 7.0% |
[ 0.5% - 1.0% ] 0.75% | 2,574,417 | 6.5% |
[ 0.5% - 1.0% ] 0.85% | 1,334,025 | 6.7% |
[ 0.5% - 1.0% ] 0.93% | 1,061,466 | 6.1% |
[ 1.0% - 1.5% ] 1.03% | 970,102 | 5.5% |
[ 1.0% - 1.5% ] 1.11% | 643,998 | 7.3% |
[ 1.0% - 1.5% ] 1.20% | 988,940 | 6.1% |
[ 1.0% - 1.5% ] 1.29% | 555,584 | 7.3% |
[ 1.0% - 1.5% ] 1.40% | 877,144 | 5.0% |
[ 1.0% - 1.5% ] 1.48% | 267,037 | 6.1% |
[ 1.5% - 2.0% ] 1.56% | 195,212 | 4.4% |
[ 1.5% - 2.0% ] 1.64% | 165,493 | 4.0% |
[ 1.5% - 2.0% ] 1.76% | 241,358 | 3.9% |
[ 1.5% - 2.0% ] 1.81% | 146,505 | 4.8% |
[ 1.5% - 2.0% ] 1.93% | 132,504 | 7.3% |
[ 1.5% - 2.0% ] 1.99% | 171,047 | 5.0% |
[ 2.0% - 2.5% ] 2.12% | 90,842 | 7.3% |
[ 2.0% - 2.5% ] 2.19% | 99,958 | 10.2% |
[ 2.0% - 2.5% ] 2.29% | 43,264 | 7.1% |
[ 2.0% - 2.5% ] 2.39% | 33,303 | 15.3% |
[ 2.0% - 2.5% ] 2.46% | 92,686 | 3.8% |
[ 2.5% - 3.0% ] 2.53% | 7,988 | 7.7% |
[ 2.5% - 3.0% ] 2.65% | 76,127 | 4.0% |
[ 2.5% - 3.0% ] 2.75% | 55,569 | 7.2% |
[ 2.5% - 3.0% ] 2.84% | 47,793 | 3.0% |
[ 2.5% - 3.0% ] 2.92% | 16,342 | 1.6% |
[ 3.0% - 3.5% ] 3.09% | 93,110 | 2.6% |
[ 3.0% - 3.5% ] 3.16% | 23,405 | 5.9% |
[ 3.0% - 3.5% ] 3.26% | 2,207 | 11.6% |
[ 3.0% - 3.5% ] 3.37% | 71,289 | 6.3% |
[ 3.0% - 3.5% ] 3.46% | 73,622 | 2.3% |
[ 3.5% - 4.0% ] 3.62% | 57,196 | 1.8% |
[ 3.5% - 4.0% ] 3.70% | 10,612 | 9.9% |
[ 3.5% - 4.0% ] 3.80% | 6,651 | 10.4% |
[ 3.5% - 4.0% ] 3.95% | 12,081 | 3.8% |
[ 4.0% - 4.5% ] 4.04% | 1,360 | 9.6% |
[ 4.0% - 4.5% ] 4.15% | 289 | 7.8% |
[ 4.0% - 4.5% ] 4.26% | 24,163 | 1.3% |
[ 4.0% - 4.5% ] 4.33% | 19,907 | 4.9% |
[ 4.0% - 4.5% ] 4.46% | 13,255 | 4.7% |
[ 4.5% - 5.0% ] 4.51% | 6,225 | 10.6% |
[ 4.5% - 5.0% ] 4.63% | 23,734 | 5.9% |
[ 4.5% - 5.0% ] 4.68% | 33,282 | 2.1% |
[ 5.0% - 5.5% ] 5.07% | 2,683 | 4.9% |
[ 5.0% - 5.5% ] 5.24% | 98,850 | 1.7% |
[ 5.0% - 5.5% ] 5.33% | 7,792 | 6.9% |
[ 5.0% - 5.5% ] 5.43% | 11,638 | 2.4% |
[ 5.5% - 6.0% ] 5.51% | 7,388 | 3.9% |
[ 5.5% - 6.0% ] 5.63% | 1,686 | 31.8% |
[ 5.5% - 6.0% ] 5.68% | 88 | 7.1% |
[ 5.5% - 6.0% ] 5.95% | 605 | 10.6% |
[ 6.0% - 6.5% ] 6.06% | 1,237 | 14.5% |
[ 6.0% - 6.5% ] 6.18% | 6,590 | 3.7% |
[ 6.0% - 6.5% ] 6.24% | 593 | 8.7% |
[ 6.0% - 6.5% ] 6.29% | 19,785 | 1.8% |
[ 6.0% - 6.5% ] 6.37% | 1,381 | 10.1% |
[ 6.5% - 7.0% ] 6.54% | 35,967 | 1.9% |
[ 6.5% - 7.0% ] 6.71% | 1,013 | 21.4% |
[ 6.5% - 7.0% ] 6.85% | 3,589 | 10.7% |
[ 7.0% - 7.5% ] 7.15% | 5,290 | 3.2% |
[ 7.0% - 7.5% ] 7.33% | 887 | 9.7% |
[ 7.5% - 8.0% ] 7.62% | 210 | 12.8% |
[ 7.5% - 8.0% ] 7.94% | 3,098 | 5.9% |
[ 7.5% - 8.0% ] 7.98% | 689 | 1.4% |
[ 8.0% - 8.5% ] 8.17% | 1,041 | 15.4% |
[ 9.0% - 9.5% ] 9.02% | 2,461 | 8.9% |
[ 10.0% - 10.5% ] 10.36% | 560 | 6.7% |
[ 12.5% - 13.0% ] 12.57% | 14,639 | 6.2% |
[ 12.5% - 13.0% ] 12.63% | 14,572 | 6.2% |