Argentinean GED/Equivalency
COMPARE
Argentinean
Select to Compare
GED/Equivalency
Argentinean GED/Equivalency
86.7%
GED/EQUIVALENCY
89.7/ 100
METRIC RATING
127th/ 347
METRIC RANK
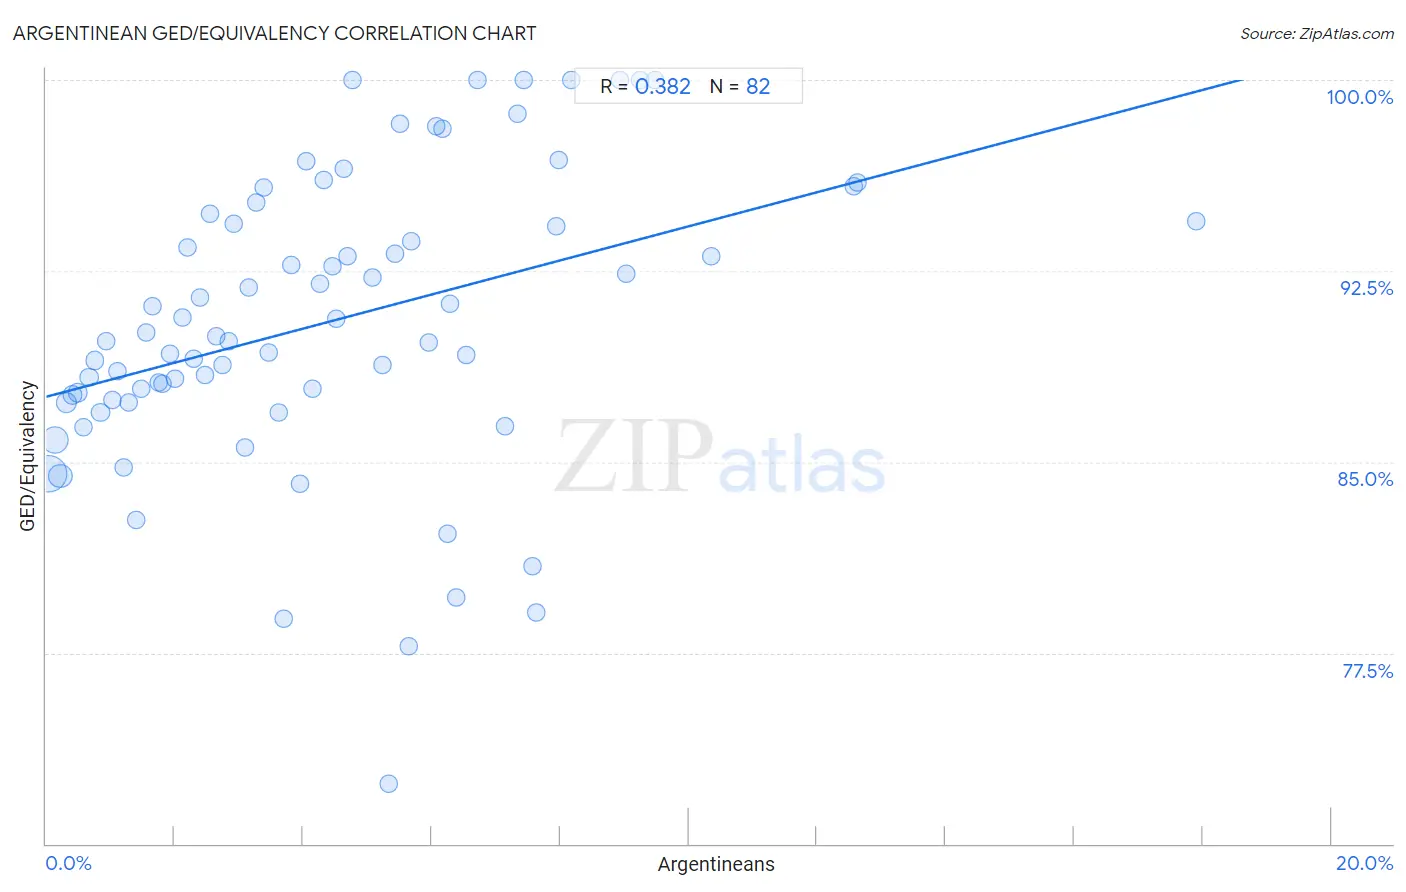
Argentinean GED/Equivalency Correlation Chart
The statistical analysis conducted on geographies consisting of 297,143,432 people shows a mild positive correlation between the proportion of Argentineans and percentage of population with at least ged/equivalency education in the United States with a correlation coefficient (R) of 0.382 and weighted average of 86.7%. On average, for every 1% (one percent) increase in Argentineans within a typical geography, there is an increase of 0.67% in percentage of population with at least ged/equivalency education.
It is essential to understand that the correlation between the percentage of Argentineans and percentage of population with at least ged/equivalency education does not imply a direct cause-and-effect relationship. It remains uncertain whether the presence of Argentineans influences an upward or downward trend in the level of percentage of population with at least ged/equivalency education within an area, or if Argentineans simply ended up residing in those areas with higher or lower levels of percentage of population with at least ged/equivalency education due to other factors.
Demographics Similar to Argentineans by GED/Equivalency
In terms of ged/equivalency, the demographic groups most similar to Argentineans are Yugoslavian (86.7%, a difference of 0.010%), Asian (86.7%, a difference of 0.030%), Immigrants from Egypt (86.7%, a difference of 0.040%), Celtic (86.7%, a difference of 0.040%), and Immigrants from Ukraine (86.7%, a difference of 0.040%).
| Demographics | Rating | Rank | GED/Equivalency |
| Scotch-Irish | 91.6 /100 | #120 | Exceptional 86.8% |
| Immigrants from Lebanon | 90.9 /100 | #121 | Exceptional 86.8% |
| Immigrants from Jordan | 90.8 /100 | #122 | Exceptional 86.8% |
| Immigrants from Italy | 90.5 /100 | #123 | Exceptional 86.7% |
| Immigrants from Egypt | 90.4 /100 | #124 | Exceptional 86.7% |
| Celtics | 90.4 /100 | #125 | Exceptional 86.7% |
| Asians | 90.3 /100 | #126 | Exceptional 86.7% |
| Argentineans | 89.7 /100 | #127 | Excellent 86.7% |
| Yugoslavians | 89.5 /100 | #128 | Excellent 86.7% |
| Immigrants from Ukraine | 88.9 /100 | #129 | Excellent 86.7% |
| Immigrants from Germany | 88.8 /100 | #130 | Excellent 86.7% |
| Immigrants from Spain | 88.5 /100 | #131 | Excellent 86.7% |
| Immigrants from Brazil | 88.4 /100 | #132 | Excellent 86.6% |
| Tsimshian | 88.3 /100 | #133 | Excellent 86.6% |
| Albanians | 87.7 /100 | #134 | Excellent 86.6% |
Argentinean GED/Equivalency Correlation Summary
| Measurement | Argentinean Data | GED/Equivalency Data |
| Minimum | 0.045% | 72.4% |
| Maximum | 17.9% | 100.0% |
| Range | 17.9% | 27.6% |
| Mean | 4.4% | 90.5% |
| Median | 3.9% | 89.9% |
| Interquartile 25% (IQ1) | 1.8% | 87.5% |
| Interquartile 75% (IQ3) | 6.2% | 94.5% |
| Interquartile Range (IQR) | 4.4% | 7.0% |
| Standard Deviation (Sample) | 3.3% | 5.8% |
| Standard Deviation (Population) | 3.3% | 5.7% |
Correlation Details
| Argentinean Percentile | Sample Size | GED/Equivalency |
[ 0.0% - 0.5% ] 0.045% | 139,477,420 | 84.5% |
[ 0.0% - 0.5% ] 0.13% | 65,110,423 | 85.9% |
[ 0.0% - 0.5% ] 0.22% | 40,744,349 | 84.5% |
[ 0.0% - 0.5% ] 0.31% | 16,521,011 | 87.3% |
[ 0.0% - 0.5% ] 0.40% | 10,020,562 | 87.6% |
[ 0.0% - 0.5% ] 0.50% | 6,293,170 | 87.7% |
[ 0.5% - 1.0% ] 0.58% | 4,138,915 | 86.4% |
[ 0.5% - 1.0% ] 0.67% | 3,037,755 | 88.3% |
[ 0.5% - 1.0% ] 0.75% | 2,584,452 | 89.0% |
[ 0.5% - 1.0% ] 0.85% | 1,341,177 | 86.9% |
[ 0.5% - 1.0% ] 0.93% | 1,061,466 | 89.7% |
[ 1.0% - 1.5% ] 1.03% | 972,410 | 87.5% |
[ 1.0% - 1.5% ] 1.11% | 677,441 | 88.6% |
[ 1.0% - 1.5% ] 1.20% | 995,284 | 84.8% |
[ 1.0% - 1.5% ] 1.29% | 555,584 | 87.3% |
[ 1.0% - 1.5% ] 1.40% | 877,928 | 82.7% |
[ 1.0% - 1.5% ] 1.48% | 267,037 | 87.9% |
[ 1.5% - 2.0% ] 1.56% | 212,667 | 90.1% |
[ 1.5% - 2.0% ] 1.64% | 180,007 | 91.1% |
[ 1.5% - 2.0% ] 1.76% | 241,358 | 88.1% |
[ 1.5% - 2.0% ] 1.81% | 154,011 | 88.1% |
[ 1.5% - 2.0% ] 1.93% | 135,496 | 89.3% |
[ 1.5% - 2.0% ] 2.00% | 201,906 | 88.3% |
[ 2.0% - 2.5% ] 2.12% | 94,649 | 90.7% |
[ 2.0% - 2.5% ] 2.19% | 101,823 | 93.4% |
[ 2.0% - 2.5% ] 2.29% | 61,444 | 89.0% |
[ 2.0% - 2.5% ] 2.39% | 33,303 | 91.5% |
[ 2.0% - 2.5% ] 2.46% | 96,652 | 88.4% |
[ 2.5% - 3.0% ] 2.55% | 30,528 | 94.7% |
[ 2.5% - 3.0% ] 2.65% | 76,703 | 89.9% |
[ 2.5% - 3.0% ] 2.75% | 59,884 | 88.8% |
[ 2.5% - 3.0% ] 2.84% | 47,970 | 89.8% |
[ 2.5% - 3.0% ] 2.92% | 16,342 | 94.4% |
[ 3.0% - 3.5% ] 3.09% | 93,687 | 85.6% |
[ 3.0% - 3.5% ] 3.16% | 23,405 | 91.9% |
[ 3.0% - 3.5% ] 3.26% | 2,207 | 95.2% |
[ 3.0% - 3.5% ] 3.38% | 74,653 | 95.8% |
[ 3.0% - 3.5% ] 3.46% | 73,622 | 89.3% |
[ 3.5% - 4.0% ] 3.62% | 57,196 | 86.9% |
[ 3.5% - 4.0% ] 3.70% | 10,989 | 78.8% |
[ 3.5% - 4.0% ] 3.80% | 6,651 | 92.7% |
[ 3.5% - 4.0% ] 3.95% | 12,579 | 84.1% |
[ 4.0% - 4.5% ] 4.04% | 1,360 | 96.8% |
[ 4.0% - 4.5% ] 4.15% | 289 | 87.9% |
[ 4.0% - 4.5% ] 4.26% | 24,163 | 92.0% |
[ 4.0% - 4.5% ] 4.33% | 19,907 | 96.1% |
[ 4.0% - 4.5% ] 4.46% | 13,255 | 92.7% |
[ 4.5% - 5.0% ] 4.51% | 6,225 | 90.6% |
[ 4.5% - 5.0% ] 4.63% | 23,734 | 96.5% |
[ 4.5% - 5.0% ] 4.68% | 33,282 | 93.1% |
[ 4.5% - 5.0% ] 4.76% | 1,994 | 100.0% |
[ 5.0% - 5.5% ] 5.07% | 2,683 | 92.2% |
[ 5.0% - 5.5% ] 5.24% | 98,850 | 88.8% |
[ 5.0% - 5.5% ] 5.33% | 7,792 | 72.4% |
[ 5.0% - 5.5% ] 5.43% | 11,638 | 93.2% |
[ 5.5% - 6.0% ] 5.51% | 7,388 | 98.3% |
[ 5.5% - 6.0% ] 5.63% | 1,917 | 77.8% |
[ 5.5% - 6.0% ] 5.68% | 88 | 93.7% |
[ 5.5% - 6.0% ] 5.95% | 605 | 89.7% |
[ 6.0% - 6.5% ] 6.06% | 1,237 | 98.2% |
[ 6.0% - 6.5% ] 6.18% | 6,590 | 98.1% |
[ 6.0% - 6.5% ] 6.24% | 593 | 82.2% |
[ 6.0% - 6.5% ] 6.29% | 19,785 | 91.2% |
[ 6.0% - 6.5% ] 6.37% | 1,381 | 79.7% |
[ 6.5% - 7.0% ] 6.54% | 35,967 | 89.2% |
[ 6.5% - 7.0% ] 6.71% | 1,013 | 100.0% |
[ 7.0% - 7.5% ] 7.15% | 5,290 | 86.4% |
[ 7.0% - 7.5% ] 7.33% | 887 | 98.7% |
[ 7.0% - 7.5% ] 7.44% | 121 | 100.0% |
[ 7.5% - 8.0% ] 7.56% | 238 | 80.9% |
[ 7.5% - 8.0% ] 7.62% | 210 | 79.1% |
[ 7.5% - 8.0% ] 7.94% | 3,174 | 94.2% |
[ 7.5% - 8.0% ] 7.98% | 689 | 96.8% |
[ 8.0% - 8.5% ] 8.17% | 1,041 | 100.0% |
[ 8.5% - 9.0% ] 8.93% | 459 | 100.0% |
[ 9.0% - 9.5% ] 9.02% | 2,461 | 92.4% |
[ 9.0% - 9.5% ] 9.24% | 563 | 100.0% |
[ 9.0% - 9.5% ] 9.47% | 285 | 100.0% |
[ 10.0% - 10.5% ] 10.36% | 560 | 93.1% |
[ 12.5% - 13.0% ] 12.57% | 14,639 | 95.8% |
[ 12.5% - 13.0% ] 12.63% | 14,572 | 96.0% |
[ 17.5% - 18.0% ] 17.90% | 391 | 94.5% |