Yaqui Married-couple Households

COMPARE

Yaqui
Race
Ancestry
AfghanAfricanAlaska NativeAlaskan AthabascanAlbanianAleutAlsatianAmericanApacheArabArapahoArgentineanArmenianAssyrian/Chaldean/SyriacAustralianAustrianBahamianBangladeshiBarbadianBasqueBelgianBelizeanBermudanBhutaneseBlackfeetBolivianBrazilianBritishBritish West IndianBulgarianBurmeseCajunCambodianCanadianCape VerdeanCarpatho RusynCelticCentral AmericanCentral American IndianCherokeeCheyenneChickasawChileanChineseChippewaChoctawColombianColvilleComancheCosta RicanCreeCreekCroatianCrowCubanCypriotCzechCzechoslovakianDanishDelawareDominicanDutchDutch West IndianEastern EuropeanEcuadorianEgyptianEnglishEstonianEthiopianEuropeanFijianFilipinoFinnishFrenchFrench American IndianFrench CanadianGermanGerman RussianGhanaianGreekGuamanian/ChamorroGuatemalanGuyaneseHaitianHmongHonduranHopiHoumaHungarianIcelanderIndian (Asian)IndonesianInupiatIranianIraqiIrishIroquoisIsraeliItalianJamaicanJapaneseJordanianKenyanKiowaKoreanLaotianLatvianLebaneseLiberianLithuanianLumbeeLuxembourgerMacedonianMalaysianMalteseMarshalleseMenomineeMexicanMexican American IndianMongolianMoroccanNative HawaiianNavajoNepaleseNew ZealanderNicaraguanNigerianNorthern EuropeanNorwegianOkinawanOsageOttawaPaiutePakistaniPalestinianPanamanianParaguayanPennsylvania GermanPeruvianPimaPolishPortuguesePotawatomiPuebloPuerto RicanPuget Sound SalishRomanianRussianSalvadoranSamoanScandinavianScotch-IrishScottishSeminoleSenegaleseSerbianShoshoneSierra LeoneanSiouxSlavicSlovakSloveneSomaliSouth AfricanSouth AmericanSouth American IndianSoviet UnionSpaniardSpanishSpanish AmericanSpanish American IndianSri LankanSubsaharan AfricanSudaneseSwedishSwissSyrianTaiwaneseThaiTlingit-HaidaTohono O'OdhamTonganTrinidadian and TobagonianTsimshianTurkishU.S. Virgin IslanderUgandanUkrainianUruguayanUteVenezuelanVietnameseWelshWest IndianYakamaYaquiYugoslavianYumanYup'ikZimbabwean
Immigration
NonimmigrantsImmigrantsAfghanistanAfricaAlbaniaArgentinaArmeniaAsiaAustraliaAustriaBahamasBangladeshBarbadosBelarusBelgiumBelizeBoliviaBosnia and HerzegovinaBrazilBulgariaBurma/MyanmarCabo VerdeCambodiaCameroonCanadaCaribbeanCentral AmericaChileChinaColombiaCongoCosta RicaCroatiaCubaCzechoslovakiaDenmarkDominicaDominican RepublicEastern AfricaEastern AsiaEastern EuropeEcuadorEgyptEl SalvadorEnglandEritreaEthiopiaEuropeFijiFranceGermanyGhanaGreeceGrenadaGuatemalaGuyanaHaitiHondurasHong KongHungaryIndiaIndonesiaIranIraqIrelandIsraelItalyJamaicaJapanJordanKazakhstanKenyaKoreaKuwaitLaosLatin AmericaLatviaLebanonLiberiaLithuaniaMalaysiaMexicoMicronesiaMiddle AfricaMoldovaMoroccoNepalNetherlandsNicaraguaNigeriaNorth AmericaNorth MacedoniaNorthern AfricaNorthern EuropeNorwayOceaniaPakistanPanamaPeruPhilippinesPolandPortugalRomaniaRussiaSaudi ArabiaScotlandSenegalSerbiaSierra LeoneSingaporeSomaliaSouth AfricaSouth AmericaSouth Central AsiaSouth Eastern AsiaSouthern EuropeSpainSri LankaSt. Vincent and the GrenadinesSudanSwedenSwitzerlandSyriaTaiwanThailandTrinidad and TobagoTurkeyUgandaUkraineUruguayUzbekistanVenezuelaVietnamWest IndiesWestern AfricaWestern AsiaWestern EuropeYemenZaireZimbabweAzores
Select to Compare
Race
Ancestry
AfghanAfricanAlaska NativeAlaskan AthabascanAlbanianAleutAlsatianAmericanApacheArabArapahoArgentineanArmenianAssyrian/Chaldean/SyriacAustralianAustrianBahamianBangladeshiBarbadianBasqueBelgianBelizeanBermudanBhutaneseBlackfeetBolivianBrazilianBritishBritish West IndianBulgarianBurmeseCajunCambodianCanadianCape VerdeanCarpatho RusynCelticCentral AmericanCentral American IndianCherokeeCheyenneChickasawChileanChineseChippewaChoctawColombianColvilleComancheCosta RicanCreeCreekCroatianCrowCubanCypriotCzechCzechoslovakianDanishDelawareDominicanDutchDutch West IndianEastern EuropeanEcuadorianEgyptianEnglishEstonianEthiopianEuropeanFijianFilipinoFinnishFrenchFrench American IndianFrench CanadianGermanGerman RussianGhanaianGreekGuamanian/ChamorroGuatemalanGuyaneseHaitianHmongHonduranHopiHoumaHungarianIcelanderIndian (Asian)IndonesianInupiatIranianIraqiIrishIroquoisIsraeliItalianJamaicanJapaneseJordanianKenyanKiowaKoreanLaotianLatvianLebaneseLiberianLithuanianLumbeeLuxembourgerMacedonianMalaysianMalteseMarshalleseMenomineeMexicanMexican American IndianMongolianMoroccanNative HawaiianNavajoNepaleseNew ZealanderNicaraguanNigerianNorthern EuropeanNorwegianOkinawanOsageOttawaPaiutePakistaniPalestinianPanamanianParaguayanPennsylvania GermanPeruvianPimaPolishPortuguesePotawatomiPuebloPuerto RicanPuget Sound SalishRomanianRussianSalvadoranSamoanScandinavianScotch-IrishScottishSeminoleSenegaleseSerbianShoshoneSierra LeoneanSiouxSlavicSlovakSloveneSomaliSouth AfricanSouth AmericanSouth American IndianSoviet UnionSpaniardSpanishSpanish AmericanSpanish American IndianSri LankanSubsaharan AfricanSudaneseSwedishSwissSyrianTaiwaneseThaiTlingit-HaidaTohono O'OdhamTonganTrinidadian and TobagonianTsimshianTurkishU.S. Virgin IslanderUgandanUkrainianUruguayanUteVenezuelanVietnameseWelshWest IndianYakamaYugoslavianYumanYup'ikZimbabwean
Immigration
NonimmigrantsImmigrantsAfghanistanAfricaAlbaniaArgentinaArmeniaAsiaAustraliaAustriaBahamasBangladeshBarbadosBelarusBelgiumBelizeBoliviaBosnia and HerzegovinaBrazilBulgariaBurma/MyanmarCabo VerdeCambodiaCameroonCanadaCaribbeanCentral AmericaChileChinaColombiaCongoCosta RicaCroatiaCubaCzechoslovakiaDenmarkDominicaDominican RepublicEastern AfricaEastern AsiaEastern EuropeEcuadorEgyptEl SalvadorEnglandEritreaEthiopiaEuropeFijiFranceGermanyGhanaGreeceGrenadaGuatemalaGuyanaHaitiHondurasHong KongHungaryIndiaIndonesiaIranIraqIrelandIsraelItalyJamaicaJapanJordanKazakhstanKenyaKoreaKuwaitLaosLatin AmericaLatviaLebanonLiberiaLithuaniaMalaysiaMexicoMicronesiaMiddle AfricaMoldovaMoroccoNepalNetherlandsNicaraguaNigeriaNorth AmericaNorth MacedoniaNorthern AfricaNorthern EuropeNorwayOceaniaPakistanPanamaPeruPhilippinesPolandPortugalRomaniaRussiaSaudi ArabiaScotlandSenegalSerbiaSierra LeoneSingaporeSomaliaSouth AfricaSouth AmericaSouth Central AsiaSouth Eastern AsiaSouthern EuropeSpainSri LankaSt. Vincent and the GrenadinesSudanSwedenSwitzerlandSyriaTaiwanThailandTrinidad and TobagoTurkeyUgandaUkraineUruguayUzbekistanVenezuelaVietnamWest IndiesWestern AfricaWestern AsiaWestern EuropeYemenZaireZimbabweAzores
Married-couple Households
Income
Poverty
Unemployment
Labor Participation
Family Structure
Vehicle Availability
Education Level
Disability

Yaqui Married-couple Households
Tragic

44.5%
MARRIED-COUPLE HOUSEHOLDS
1.2/ 100
METRIC RATING
236th/ 347
METRIC RANK

Yaqui Married-couple Households Correlation Chart

The statistical analysis conducted on geographies consisting of 107,720,236 people shows no correlation between the proportion of Yaqui and percentage of married-couple family households in the United States with a correlation coefficient (R) of -0.039 and weighted average of 44.5%. On average, for every 1% (one percent) increase in Yaqui within a typical geography, there is a decrease of 0.075% in percentage of married-couple family households.
Yaqui Married-couple Households
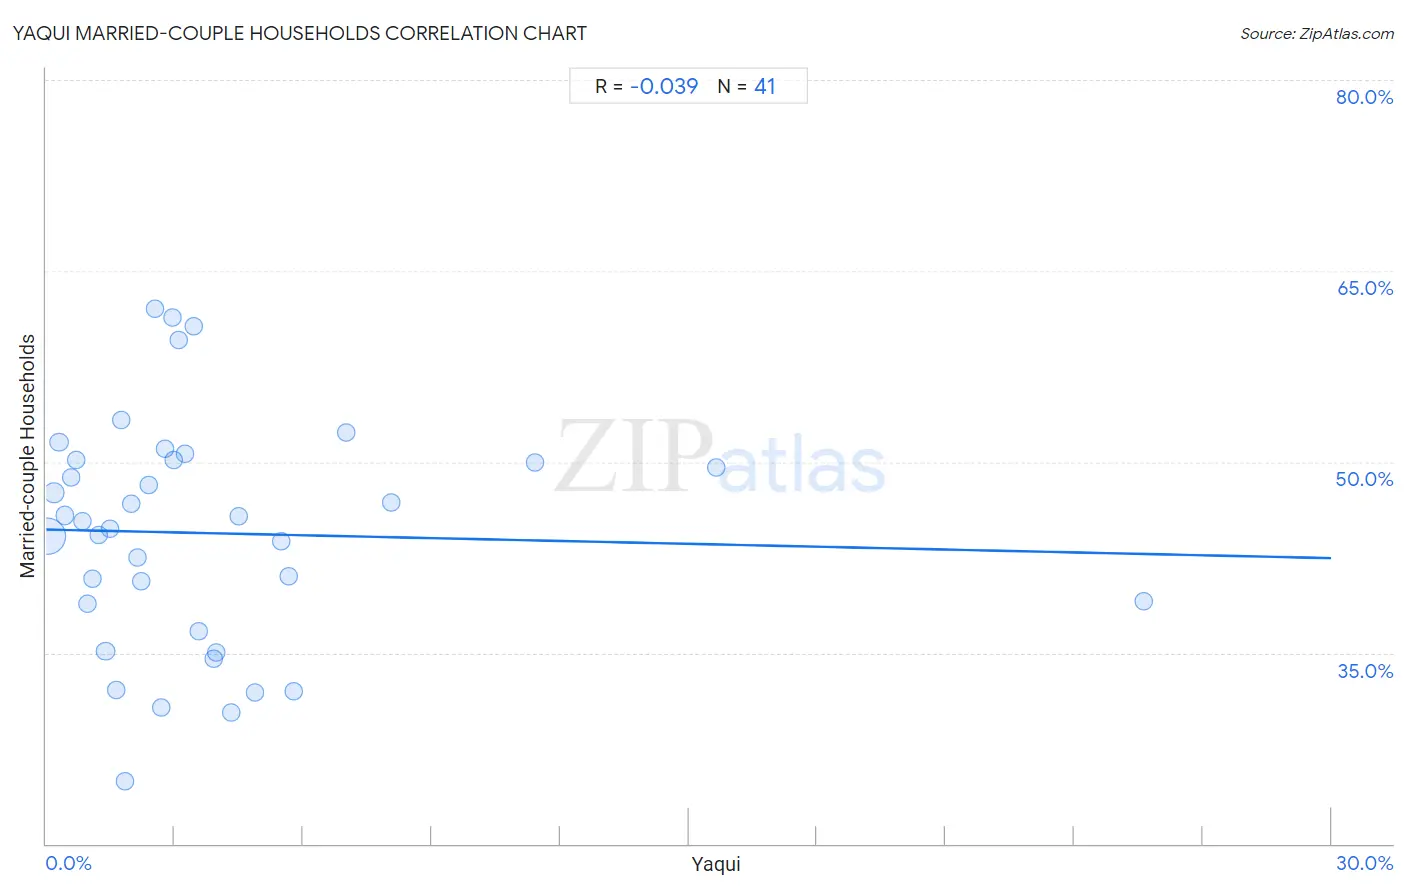
It is essential to understand that the correlation between the percentage of Yaqui and percentage of married-couple family households does not imply a direct cause-and-effect relationship. It remains uncertain whether the presence of Yaqui influences an upward or downward trend in the level of percentage of married-couple family households within an area, or if Yaqui simply ended up residing in those areas with higher or lower levels of percentage of married-couple family households due to other factors.

Demographics Similar to Yaqui by Married-couple Households

In terms of married-couple households, the demographic groups most similar to Yaqui are Immigrants from Nicaragua (44.5%, a difference of 0.0%), Comanche (44.5%, a difference of 0.030%), Immigrants from Panama (44.6%, a difference of 0.080%), Immigrants from Uruguay (44.5%, a difference of 0.080%), and Spanish American (44.5%, a difference of 0.10%).
DemographicsRating | RankMarried-couple Households
Immigrants from Latin America
1.6
/100
|
#229
Tragic
44.7%
Soviet Union
1.6
/100
|
#230
Tragic
44.6%
Houma
1.5
/100
|
#231
Tragic
44.6%
Marshallese
1.5
/100
|
#232
Tragic
44.6%
Immigrants from Uganda
1.5
/100
|
#233
Tragic
44.6%
Immigrants from Panama
1.3
/100
|
#234
Tragic
44.6%
Immigrants from Nicaragua
1.2
/100
|
#235
Tragic
44.5%
Yaqui
1.2
/100
|
#236
Tragic
44.5%
Comanche
1.2
/100
|
#237
Tragic
44.5%
Immigrants from Uruguay
1.1
/100
|
#238
Tragic
44.5%
Spanish Americans
1.1
/100
|
#239
Tragic
44.5%
Ute
1.0
/100
|
#240
Tragic
44.4%
Immigrants from Bosnia and Herzegovina
1.0
/100
|
#241
Tragic
44.4%
Immigrants from Albania
1.0
/100
|
#242
Tragic
44.4%
Immigrants from Saudi Arabia
0.9
/100
|
#243
Tragic
44.4%

Yaqui Married-couple Households Correlation Summary

MeasurementYaqui DataMarried-couple Households Data
Minimum0.033%25.0%
Maximum25.6%62.1%
Range25.6%37.1%
Mean3.8%44.4%
Median2.7%45.4%
Interquartile 25% (IQ1)1.3%37.8%
Interquartile 75% (IQ3)4.4%50.2%
Interquartile Range (IQR)3.1%12.4%
Standard Deviation (Sample)4.6%9.0%
Standard Deviation (Population)4.6%8.9%

Correlation Details

Yaqui PercentileSample SizeMarried-couple Households
[
0.0%
-
0.5%
]
0.033%
90,909,94344.2%
[
0.0%
-
0.5%
]
0.18%
9,594,30847.6%
[
0.0%
-
0.5%
]
0.30%
2,981,80151.6%
[
0.0%
-
0.5%
]
0.44%
1,587,38945.8%
[
0.5%
-
1.0%
]
0.58%
437,75848.8%
[
0.5%
-
1.0%
]
0.69%
356,82650.2%
[
0.5%
-
1.0%
]
0.83%
303,43245.4%
[
0.5%
-
1.0%
]
0.96%
224,71438.9%
[
1.0%
-
1.5%
]
1.08%
79,63240.8%
[
1.0%
-
1.5%
]
1.22%
162,23644.3%
[
1.0%
-
1.5%
]
1.39%
585,53535.1%
[
1.0%
-
1.5%
]
1.48%
25,70244.7%
[
1.5%
-
2.0%
]
1.65%
6,06632.1%
[
1.5%
-
2.0%
]
1.76%
16,93753.3%
[
1.5%
-
2.0%
]
1.83%
61,13925.0%
[
1.5%
-
2.0%
]
1.97%
8,06846.7%
[
2.0%
-
2.5%
]
2.13%
23,88542.5%
[
2.0%
-
2.5%
]
2.21%
96,19140.6%
[
2.0%
-
2.5%
]
2.41%
36,65048.2%
[
2.5%
-
3.0%
]
2.55%
78462.1%
[
2.5%
-
3.0%
]
2.68%
1,45430.7%
[
2.5%
-
3.0%
]
2.78%
14451.0%
[
2.5%
-
3.0%
]
2.94%
7,35961.4%
[
2.5%
-
3.0%
]
2.96%
2,93650.1%
[
3.0%
-
3.5%
]
3.08%
6,26059.6%
[
3.0%
-
3.5%
]
3.23%
36,82850.7%
[
3.0%
-
3.5%
]
3.43%
37960.6%
[
3.5%
-
4.0%
]
3.55%
45,88136.6%
[
3.5%
-
4.0%
]
3.90%
15,90934.6%
[
3.5%
-
4.0%
]
3.98%
57,89735.0%
[
4.0%
-
4.5%
]
4.31%
5,12530.3%
[
4.0%
-
4.5%
]
4.50%
1,84545.7%
[
4.5%
-
5.0%
]
4.87%
1,06731.9%
[
5.0%
-
5.5%
]
5.49%
5,57443.7%
[
5.5%
-
6.0%
]
5.65%
4,33741.0%
[
5.5%
-
6.0%
]
5.77%
5232.0%
[
7.0%
-
7.5%
]
7.00%
45752.3%
[
8.0%
-
8.5%
]
8.06%
1,26646.8%
[
11.0%
-
11.5%
]
11.40%
11450.0%
[
15.5%
-
16.0%
]
15.65%
21,02149.5%
[
25.5%
-
26.0%
]
25.62%
5,33539.1%