Yaqui Disability
COMPARE
Yaqui
Select to Compare
Disability
Yaqui Disability
13.1%
DISABILITY
0.0/ 100
METRIC RATING
291st/ 347
METRIC RANK
Yaqui Disability Correlation Chart
The statistical analysis conducted on geographies consisting of 107,721,250 people shows no correlation between the proportion of Yaqui and percentage of population with a disability in the United States with a correlation coefficient (R) of -0.022 and weighted average of 13.1%. On average, for every 1% (one percent) increase in Yaqui within a typical geography, there is a decrease of 0.026% in percentage of population with a disability.
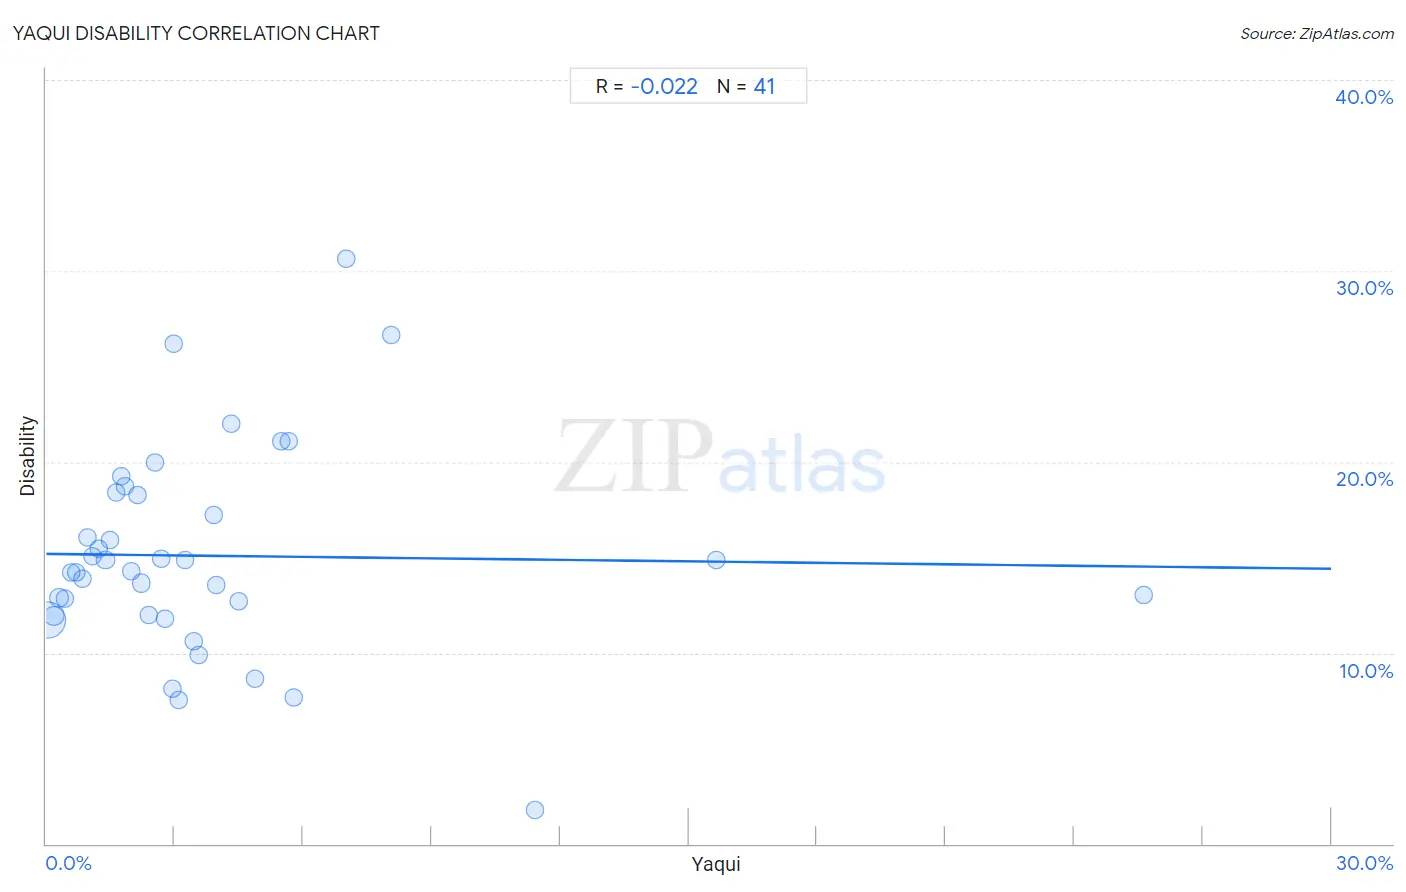
It is essential to understand that the correlation between the percentage of Yaqui and percentage of population with a disability does not imply a direct cause-and-effect relationship. It remains uncertain whether the presence of Yaqui influences an upward or downward trend in the level of percentage of population with a disability within an area, or if Yaqui simply ended up residing in those areas with higher or lower levels of percentage of population with a disability due to other factors.
Demographics Similar to Yaqui by Disability
In terms of disability, the demographic groups most similar to Yaqui are Cheyenne (13.0%, a difference of 0.23%), Slovak (13.0%, a difference of 0.28%), White/Caucasian (13.0%, a difference of 0.29%), African (13.0%, a difference of 0.31%), and Aleut (13.1%, a difference of 0.36%).
| Demographics | Rating | Rank | Disability |
| Welsh | 0.0 /100 | #284 | Tragic 12.9% |
| Crow | 0.0 /100 | #285 | Tragic 12.9% |
| English | 0.0 /100 | #286 | Tragic 13.0% |
| Africans | 0.0 /100 | #287 | Tragic 13.0% |
| Whites/Caucasians | 0.0 /100 | #288 | Tragic 13.0% |
| Slovaks | 0.0 /100 | #289 | Tragic 13.0% |
| Cheyenne | 0.0 /100 | #290 | Tragic 13.0% |
| Yaqui | 0.0 /100 | #291 | Tragic 13.1% |
| Aleuts | 0.0 /100 | #292 | Tragic 13.1% |
| Marshallese | 0.0 /100 | #293 | Tragic 13.1% |
| Celtics | 0.0 /100 | #294 | Tragic 13.1% |
| Nonimmigrants | 0.0 /100 | #295 | Tragic 13.2% |
| Central American Indians | 0.0 /100 | #296 | Tragic 13.2% |
| Hopi | 0.0 /100 | #297 | Tragic 13.2% |
| Alaska Natives | 0.0 /100 | #298 | Tragic 13.2% |
Yaqui Disability Correlation Summary
| Measurement | Yaqui Data | Disability Data |
| Minimum | 0.033% | 1.8% |
| Maximum | 25.6% | 30.6% |
| Range | 25.6% | 28.9% |
| Mean | 3.8% | 15.1% |
| Median | 2.7% | 14.3% |
| Interquartile 25% (IQ1) | 1.3% | 12.0% |
| Interquartile 75% (IQ3) | 4.4% | 18.3% |
| Interquartile Range (IQR) | 3.1% | 6.3% |
| Standard Deviation (Sample) | 4.6% | 5.5% |
| Standard Deviation (Population) | 4.6% | 5.4% |
Correlation Details
| Yaqui Percentile | Sample Size | Disability |
[ 0.0% - 0.5% ] 0.033% | 90,909,943 | 11.7% |
[ 0.0% - 0.5% ] 0.18% | 9,594,308 | 11.9% |
[ 0.0% - 0.5% ] 0.30% | 2,981,801 | 12.9% |
[ 0.0% - 0.5% ] 0.44% | 1,587,389 | 12.9% |
[ 0.5% - 1.0% ] 0.58% | 437,758 | 14.2% |
[ 0.5% - 1.0% ] 0.69% | 356,826 | 14.2% |
[ 0.5% - 1.0% ] 0.83% | 303,432 | 13.9% |
[ 0.5% - 1.0% ] 0.96% | 224,714 | 16.1% |
[ 1.0% - 1.5% ] 1.08% | 79,632 | 15.0% |
[ 1.0% - 1.5% ] 1.22% | 162,236 | 15.4% |
[ 1.0% - 1.5% ] 1.39% | 585,535 | 14.9% |
[ 1.0% - 1.5% ] 1.48% | 25,702 | 15.9% |
[ 1.5% - 2.0% ] 1.65% | 6,066 | 18.4% |
[ 1.5% - 2.0% ] 1.76% | 16,937 | 19.2% |
[ 1.5% - 2.0% ] 1.83% | 61,139 | 18.7% |
[ 1.5% - 2.0% ] 1.97% | 8,068 | 14.3% |
[ 2.0% - 2.5% ] 2.13% | 24,899 | 18.3% |
[ 2.0% - 2.5% ] 2.21% | 96,191 | 13.7% |
[ 2.0% - 2.5% ] 2.41% | 36,650 | 12.0% |
[ 2.5% - 3.0% ] 2.55% | 784 | 20.0% |
[ 2.5% - 3.0% ] 2.68% | 1,454 | 14.9% |
[ 2.5% - 3.0% ] 2.78% | 144 | 11.8% |
[ 2.5% - 3.0% ] 2.94% | 7,359 | 8.1% |
[ 2.5% - 3.0% ] 2.96% | 2,936 | 26.2% |
[ 3.0% - 3.5% ] 3.08% | 6,260 | 7.6% |
[ 3.0% - 3.5% ] 3.23% | 36,828 | 14.8% |
[ 3.0% - 3.5% ] 3.43% | 379 | 10.6% |
[ 3.5% - 4.0% ] 3.55% | 45,881 | 9.9% |
[ 3.5% - 4.0% ] 3.90% | 15,909 | 17.2% |
[ 3.5% - 4.0% ] 3.98% | 57,897 | 13.6% |
[ 4.0% - 4.5% ] 4.31% | 5,125 | 22.0% |
[ 4.0% - 4.5% ] 4.50% | 1,845 | 12.7% |
[ 4.5% - 5.0% ] 4.87% | 1,067 | 8.6% |
[ 5.0% - 5.5% ] 5.49% | 5,574 | 21.1% |
[ 5.5% - 6.0% ] 5.65% | 4,337 | 21.1% |
[ 5.5% - 6.0% ] 5.77% | 52 | 7.7% |
[ 7.0% - 7.5% ] 7.00% | 457 | 30.6% |
[ 8.0% - 8.5% ] 8.06% | 1,266 | 26.6% |
[ 11.0% - 11.5% ] 11.40% | 114 | 1.8% |
[ 15.5% - 16.0% ] 15.65% | 21,021 | 14.8% |
[ 25.5% - 26.0% ] 25.62% | 5,335 | 13.0% |