Yaqui Self-Care Disability

COMPARE

Yaqui
Race
Ancestry
AfghanAfricanAlaska NativeAlaskan AthabascanAlbanianAleutAlsatianAmericanApacheArabArapahoArgentineanArmenianAssyrian/Chaldean/SyriacAustralianAustrianBahamianBangladeshiBarbadianBasqueBelgianBelizeanBermudanBhutaneseBlackfeetBolivianBrazilianBritishBritish West IndianBulgarianBurmeseCajunCambodianCanadianCape VerdeanCarpatho RusynCelticCentral AmericanCentral American IndianCherokeeCheyenneChickasawChileanChineseChippewaChoctawColombianColvilleComancheCosta RicanCreeCreekCroatianCrowCubanCypriotCzechCzechoslovakianDanishDelawareDominicanDutchDutch West IndianEastern EuropeanEcuadorianEgyptianEnglishEstonianEthiopianEuropeanFijianFilipinoFinnishFrenchFrench American IndianFrench CanadianGermanGerman RussianGhanaianGreekGuamanian/ChamorroGuatemalanGuyaneseHaitianHmongHonduranHopiHoumaHungarianIcelanderIndian (Asian)IndonesianInupiatIranianIraqiIrishIroquoisIsraeliItalianJamaicanJapaneseJordanianKenyanKiowaKoreanLaotianLatvianLebaneseLiberianLithuanianLumbeeLuxembourgerMacedonianMalaysianMalteseMarshalleseMenomineeMexicanMexican American IndianMongolianMoroccanNative HawaiianNavajoNepaleseNew ZealanderNicaraguanNigerianNorthern EuropeanNorwegianOkinawanOsageOttawaPaiutePakistaniPalestinianPanamanianParaguayanPennsylvania GermanPeruvianPimaPolishPortuguesePotawatomiPuebloPuerto RicanPuget Sound SalishRomanianRussianSalvadoranSamoanScandinavianScotch-IrishScottishSeminoleSenegaleseSerbianShoshoneSierra LeoneanSiouxSlavicSlovakSloveneSomaliSouth AfricanSouth AmericanSouth American IndianSoviet UnionSpaniardSpanishSpanish AmericanSpanish American IndianSri LankanSubsaharan AfricanSudaneseSwedishSwissSyrianTaiwaneseThaiTlingit-HaidaTohono O'OdhamTonganTrinidadian and TobagonianTsimshianTurkishU.S. Virgin IslanderUgandanUkrainianUruguayanUteVenezuelanVietnameseWelshWest IndianYakamaYaquiYugoslavianYumanYup'ikZimbabwean
Immigration
NonimmigrantsImmigrantsAfghanistanAfricaAlbaniaArgentinaArmeniaAsiaAustraliaAustriaBahamasBangladeshBarbadosBelarusBelgiumBelizeBoliviaBosnia and HerzegovinaBrazilBulgariaBurma/MyanmarCabo VerdeCambodiaCameroonCanadaCaribbeanCentral AmericaChileChinaColombiaCongoCosta RicaCroatiaCubaCzechoslovakiaDenmarkDominicaDominican RepublicEastern AfricaEastern AsiaEastern EuropeEcuadorEgyptEl SalvadorEnglandEritreaEthiopiaEuropeFijiFranceGermanyGhanaGreeceGrenadaGuatemalaGuyanaHaitiHondurasHong KongHungaryIndiaIndonesiaIranIraqIrelandIsraelItalyJamaicaJapanJordanKazakhstanKenyaKoreaKuwaitLaosLatin AmericaLatviaLebanonLiberiaLithuaniaMalaysiaMexicoMicronesiaMiddle AfricaMoldovaMoroccoNepalNetherlandsNicaraguaNigeriaNorth AmericaNorth MacedoniaNorthern AfricaNorthern EuropeNorwayOceaniaPakistanPanamaPeruPhilippinesPolandPortugalRomaniaRussiaSaudi ArabiaScotlandSenegalSerbiaSierra LeoneSingaporeSomaliaSouth AfricaSouth AmericaSouth Central AsiaSouth Eastern AsiaSouthern EuropeSpainSri LankaSt. Vincent and the GrenadinesSudanSwedenSwitzerlandSyriaTaiwanThailandTrinidad and TobagoTurkeyUgandaUkraineUruguayUzbekistanVenezuelaVietnamWest IndiesWestern AfricaWestern AsiaWestern EuropeYemenZaireZimbabweAzores
Select to Compare
Race
Ancestry
AfghanAfricanAlaska NativeAlaskan AthabascanAlbanianAleutAlsatianAmericanApacheArabArapahoArgentineanArmenianAssyrian/Chaldean/SyriacAustralianAustrianBahamianBangladeshiBarbadianBasqueBelgianBelizeanBermudanBhutaneseBlackfeetBolivianBrazilianBritishBritish West IndianBulgarianBurmeseCajunCambodianCanadianCape VerdeanCarpatho RusynCelticCentral AmericanCentral American IndianCherokeeCheyenneChickasawChileanChineseChippewaChoctawColombianColvilleComancheCosta RicanCreeCreekCroatianCrowCubanCypriotCzechCzechoslovakianDanishDelawareDominicanDutchDutch West IndianEastern EuropeanEcuadorianEgyptianEnglishEstonianEthiopianEuropeanFijianFilipinoFinnishFrenchFrench American IndianFrench CanadianGermanGerman RussianGhanaianGreekGuamanian/ChamorroGuatemalanGuyaneseHaitianHmongHonduranHopiHoumaHungarianIcelanderIndian (Asian)IndonesianInupiatIranianIraqiIrishIroquoisIsraeliItalianJamaicanJapaneseJordanianKenyanKiowaKoreanLaotianLatvianLebaneseLiberianLithuanianLumbeeLuxembourgerMacedonianMalaysianMalteseMarshalleseMenomineeMexicanMexican American IndianMongolianMoroccanNative HawaiianNavajoNepaleseNew ZealanderNicaraguanNigerianNorthern EuropeanNorwegianOkinawanOsageOttawaPaiutePakistaniPalestinianPanamanianParaguayanPennsylvania GermanPeruvianPimaPolishPortuguesePotawatomiPuebloPuerto RicanPuget Sound SalishRomanianRussianSalvadoranSamoanScandinavianScotch-IrishScottishSeminoleSenegaleseSerbianShoshoneSierra LeoneanSiouxSlavicSlovakSloveneSomaliSouth AfricanSouth AmericanSouth American IndianSoviet UnionSpaniardSpanishSpanish AmericanSpanish American IndianSri LankanSubsaharan AfricanSudaneseSwedishSwissSyrianTaiwaneseThaiTlingit-HaidaTohono O'OdhamTonganTrinidadian and TobagonianTsimshianTurkishU.S. Virgin IslanderUgandanUkrainianUruguayanUteVenezuelanVietnameseWelshWest IndianYakamaYugoslavianYumanYup'ikZimbabwean
Immigration
NonimmigrantsImmigrantsAfghanistanAfricaAlbaniaArgentinaArmeniaAsiaAustraliaAustriaBahamasBangladeshBarbadosBelarusBelgiumBelizeBoliviaBosnia and HerzegovinaBrazilBulgariaBurma/MyanmarCabo VerdeCambodiaCameroonCanadaCaribbeanCentral AmericaChileChinaColombiaCongoCosta RicaCroatiaCubaCzechoslovakiaDenmarkDominicaDominican RepublicEastern AfricaEastern AsiaEastern EuropeEcuadorEgyptEl SalvadorEnglandEritreaEthiopiaEuropeFijiFranceGermanyGhanaGreeceGrenadaGuatemalaGuyanaHaitiHondurasHong KongHungaryIndiaIndonesiaIranIraqIrelandIsraelItalyJamaicaJapanJordanKazakhstanKenyaKoreaKuwaitLaosLatin AmericaLatviaLebanonLiberiaLithuaniaMalaysiaMexicoMicronesiaMiddle AfricaMoldovaMoroccoNepalNetherlandsNicaraguaNigeriaNorth AmericaNorth MacedoniaNorthern AfricaNorthern EuropeNorwayOceaniaPakistanPanamaPeruPhilippinesPolandPortugalRomaniaRussiaSaudi ArabiaScotlandSenegalSerbiaSierra LeoneSingaporeSomaliaSouth AfricaSouth AmericaSouth Central AsiaSouth Eastern AsiaSouthern EuropeSpainSri LankaSt. Vincent and the GrenadinesSudanSwedenSwitzerlandSyriaTaiwanThailandTrinidad and TobagoTurkeyUgandaUkraineUruguayUzbekistanVenezuelaVietnamWest IndiesWestern AfricaWestern AsiaWestern EuropeYemenZaireZimbabweAzores
Self-Care Disability
Income
Poverty
Unemployment
Labor Participation
Family Structure
Vehicle Availability
Education Level
Disability

Yaqui Self-Care Disability
Tragic

2.7%
SELF-CARE DISABILITY
0.1/ 100
METRIC RATING
267th/ 347
METRIC RANK

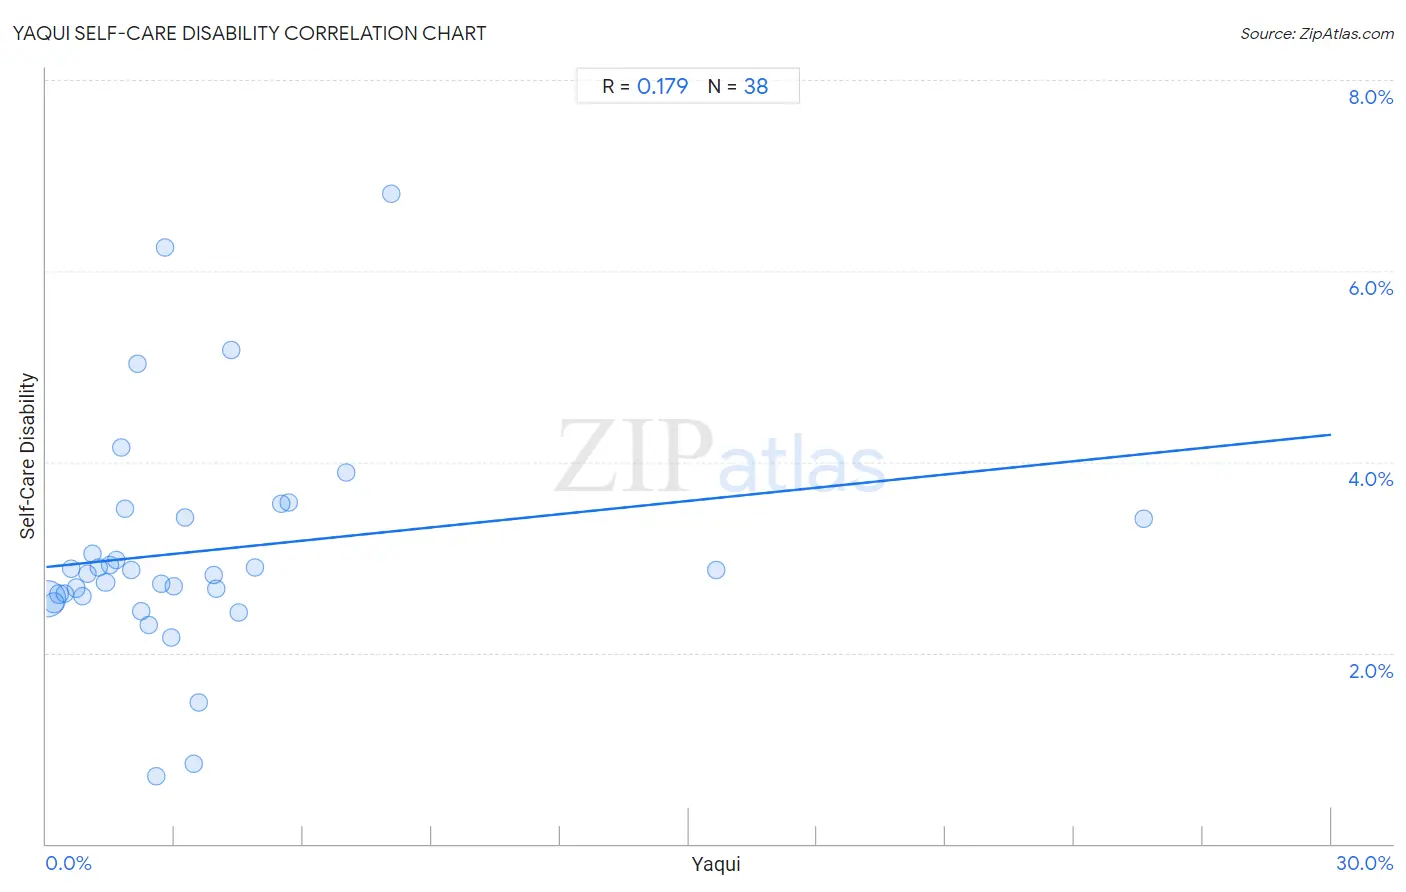
Yaqui Self-Care Disability Correlation Chart

The statistical analysis conducted on geographies consisting of 107,691,842 people shows a poor positive correlation between the proportion of Yaqui and percentage of population with self-care disability in the United States with a correlation coefficient (R) of 0.179 and weighted average of 2.7%. On average, for every 1% (one percent) increase in Yaqui within a typical geography, there is an increase of 0.046% in percentage of population with self-care disability.
Yaqui Self-Care Disability
It is essential to understand that the correlation between the percentage of Yaqui and percentage of population with self-care disability does not imply a direct cause-and-effect relationship. It remains uncertain whether the presence of Yaqui influences an upward or downward trend in the level of percentage of population with self-care disability within an area, or if Yaqui simply ended up residing in those areas with higher or lower levels of percentage of population with self-care disability due to other factors.

Demographics Similar to Yaqui by Self-Care Disability

In terms of self-care disability, the demographic groups most similar to Yaqui are Immigrants from Mexico (2.7%, a difference of 0.050%), Immigrants from Cambodia (2.7%, a difference of 0.19%), U.S. Virgin Islander (2.7%, a difference of 0.22%), Immigrants from Nicaragua (2.7%, a difference of 0.25%), and Immigrants from Micronesia (2.7%, a difference of 0.25%).
DemographicsRating | RankSelf-Care Disability
Chippewa
0.2
/100
|
#260
Tragic
2.6%
Arapaho
0.2
/100
|
#261
Tragic
2.6%
Shoshone
0.2
/100
|
#262
Tragic
2.7%
Immigrants from Latin America
0.2
/100
|
#263
Tragic
2.7%
Immigrants from Iran
0.2
/100
|
#264
Tragic
2.7%
Immigrants from Nicaragua
0.2
/100
|
#265
Tragic
2.7%
Immigrants from Cambodia
0.1
/100
|
#266
Tragic
2.7%
Yaqui
0.1
/100
|
#267
Tragic
2.7%
Immigrants from Mexico
0.1
/100
|
#268
Tragic
2.7%
U.S. Virgin Islanders
0.1
/100
|
#269
Tragic
2.7%
Immigrants from Micronesia
0.1
/100
|
#270
Tragic
2.7%
Trinidadians and Tobagonians
0.1
/100
|
#271
Tragic
2.7%
Immigrants from Laos
0.1
/100
|
#272
Tragic
2.7%
Mexicans
0.1
/100
|
#273
Tragic
2.7%
Yakama
0.1
/100
|
#274
Tragic
2.7%

Yaqui Self-Care Disability Correlation Summary

MeasurementYaqui DataSelf-Care Disability Data
Minimum0.033%0.71%
Maximum25.6%6.8%
Range25.6%6.1%
Mean3.6%3.1%
Median2.5%2.8%
Interquartile 25% (IQ1)1.2%2.6%
Interquartile 75% (IQ3)4.0%3.4%
Interquartile Range (IQR)2.8%0.82%
Standard Deviation (Sample)4.6%1.2%
Standard Deviation (Population)4.6%1.2%

Correlation Details

Yaqui PercentileSample SizeSelf-Care Disability
[
0.0%
-
0.5%
]
0.033%
90,903,0622.6%
[
0.0%
-
0.5%
]
0.18%
9,590,1972.5%
[
0.0%
-
0.5%
]
0.30%
2,981,8012.6%
[
0.0%
-
0.5%
]
0.44%
1,587,3892.6%
[
0.5%
-
1.0%
]
0.58%
437,7582.9%
[
0.5%
-
1.0%
]
0.69%
356,8262.7%
[
0.5%
-
1.0%
]
0.83%
303,4322.6%
[
0.5%
-
1.0%
]
0.96%
222,1862.8%
[
1.0%
-
1.5%
]
1.08%
79,6323.0%
[
1.0%
-
1.5%
]
1.22%
162,2362.9%
[
1.0%
-
1.5%
]
1.39%
583,7572.7%
[
1.0%
-
1.5%
]
1.48%
25,3752.9%
[
1.5%
-
2.0%
]
1.65%
6,0663.0%
[
1.5%
-
2.0%
]
1.76%
16,9374.1%
[
1.5%
-
2.0%
]
1.83%
61,1393.5%
[
1.5%
-
2.0%
]
1.97%
8,0162.9%
[
2.0%
-
2.5%
]
2.13%
24,8995.0%
[
2.0%
-
2.5%
]
2.21%
96,1912.4%
[
2.0%
-
2.5%
]
2.41%
36,6502.3%
[
2.5%
-
3.0%
]
2.56%
6260.71%
[
2.5%
-
3.0%
]
2.68%
1,4542.7%
[
2.5%
-
3.0%
]
2.78%
1446.2%
[
2.5%
-
3.0%
]
2.92%
7882.2%
[
2.5%
-
3.0%
]
2.96%
2,9362.7%
[
3.0%
-
3.5%
]
3.23%
36,8283.4%
[
3.0%
-
3.5%
]
3.43%
3790.84%
[
3.5%
-
4.0%
]
3.55%
45,8811.5%
[
3.5%
-
4.0%
]
3.90%
15,9092.8%
[
3.5%
-
4.0%
]
3.98%
57,8972.7%
[
4.0%
-
4.5%
]
4.31%
5,1255.2%
[
4.0%
-
4.5%
]
4.50%
1,8452.4%
[
4.5%
-
5.0%
]
4.87%
9652.9%
[
5.0%
-
5.5%
]
5.49%
5,1003.6%
[
5.5%
-
6.0%
]
5.65%
4,3373.6%
[
7.0%
-
7.5%
]
7.00%
4573.9%
[
8.0%
-
8.5%
]
8.06%
1,2666.8%
[
15.5%
-
16.0%
]
15.65%
21,0212.9%
[
25.5%
-
26.0%
]
25.62%
5,3353.4%