Yaqui Married-Couple Family Poverty

COMPARE

Yaqui
Race
Ancestry
AfghanAfricanAlaska NativeAlaskan AthabascanAlbanianAleutAlsatianAmericanApacheArabArapahoArgentineanArmenianAssyrian/Chaldean/SyriacAustralianAustrianBahamianBangladeshiBarbadianBasqueBelgianBelizeanBermudanBhutaneseBlackfeetBolivianBrazilianBritishBritish West IndianBulgarianBurmeseCajunCambodianCanadianCape VerdeanCarpatho RusynCelticCentral AmericanCentral American IndianCherokeeCheyenneChickasawChileanChineseChippewaChoctawColombianColvilleComancheCosta RicanCreeCreekCroatianCrowCubanCypriotCzechCzechoslovakianDanishDelawareDominicanDutchDutch West IndianEastern EuropeanEcuadorianEgyptianEnglishEstonianEthiopianEuropeanFijianFilipinoFinnishFrenchFrench American IndianFrench CanadianGermanGerman RussianGhanaianGreekGuamanian/ChamorroGuatemalanGuyaneseHaitianHmongHonduranHopiHoumaHungarianIcelanderIndian (Asian)IndonesianInupiatIranianIraqiIrishIroquoisIsraeliItalianJamaicanJapaneseJordanianKenyanKiowaKoreanLaotianLatvianLebaneseLiberianLithuanianLumbeeLuxembourgerMacedonianMalaysianMalteseMarshalleseMenomineeMexicanMexican American IndianMongolianMoroccanNative HawaiianNavajoNepaleseNew ZealanderNicaraguanNigerianNorthern EuropeanNorwegianOkinawanOsageOttawaPaiutePakistaniPalestinianPanamanianParaguayanPennsylvania GermanPeruvianPimaPolishPortuguesePotawatomiPuebloPuerto RicanPuget Sound SalishRomanianRussianSalvadoranSamoanScandinavianScotch-IrishScottishSeminoleSenegaleseSerbianShoshoneSierra LeoneanSiouxSlavicSlovakSloveneSomaliSouth AfricanSouth AmericanSouth American IndianSoviet UnionSpaniardSpanishSpanish AmericanSpanish American IndianSri LankanSubsaharan AfricanSudaneseSwedishSwissSyrianTaiwaneseThaiTlingit-HaidaTohono O'OdhamTonganTrinidadian and TobagonianTsimshianTurkishU.S. Virgin IslanderUgandanUkrainianUruguayanUteVenezuelanVietnameseWelshWest IndianYakamaYaquiYugoslavianYumanYup'ikZimbabwean
Immigration
NonimmigrantsImmigrantsAfghanistanAfricaAlbaniaArgentinaArmeniaAsiaAustraliaAustriaBahamasBangladeshBarbadosBelarusBelgiumBelizeBoliviaBosnia and HerzegovinaBrazilBulgariaBurma/MyanmarCabo VerdeCambodiaCameroonCanadaCaribbeanCentral AmericaChileChinaColombiaCongoCosta RicaCroatiaCubaCzechoslovakiaDenmarkDominicaDominican RepublicEastern AfricaEastern AsiaEastern EuropeEcuadorEgyptEl SalvadorEnglandEritreaEthiopiaEuropeFijiFranceGermanyGhanaGreeceGrenadaGuatemalaGuyanaHaitiHondurasHong KongHungaryIndiaIndonesiaIranIraqIrelandIsraelItalyJamaicaJapanJordanKazakhstanKenyaKoreaKuwaitLaosLatin AmericaLatviaLebanonLiberiaLithuaniaMalaysiaMexicoMicronesiaMiddle AfricaMoldovaMoroccoNepalNetherlandsNicaraguaNigeriaNorth AmericaNorth MacedoniaNorthern AfricaNorthern EuropeNorwayOceaniaPakistanPanamaPeruPhilippinesPolandPortugalRomaniaRussiaSaudi ArabiaScotlandSenegalSerbiaSierra LeoneSingaporeSomaliaSouth AfricaSouth AmericaSouth Central AsiaSouth Eastern AsiaSouthern EuropeSpainSri LankaSt. Vincent and the GrenadinesSudanSwedenSwitzerlandSyriaTaiwanThailandTrinidad and TobagoTurkeyUgandaUkraineUruguayUzbekistanVenezuelaVietnamWest IndiesWestern AfricaWestern AsiaWestern EuropeYemenZaireZimbabweAzores
Select to Compare
Race
Ancestry
AfghanAfricanAlaska NativeAlaskan AthabascanAlbanianAleutAlsatianAmericanApacheArabArapahoArgentineanArmenianAssyrian/Chaldean/SyriacAustralianAustrianBahamianBangladeshiBarbadianBasqueBelgianBelizeanBermudanBhutaneseBlackfeetBolivianBrazilianBritishBritish West IndianBulgarianBurmeseCajunCambodianCanadianCape VerdeanCarpatho RusynCelticCentral AmericanCentral American IndianCherokeeCheyenneChickasawChileanChineseChippewaChoctawColombianColvilleComancheCosta RicanCreeCreekCroatianCrowCubanCypriotCzechCzechoslovakianDanishDelawareDominicanDutchDutch West IndianEastern EuropeanEcuadorianEgyptianEnglishEstonianEthiopianEuropeanFijianFilipinoFinnishFrenchFrench American IndianFrench CanadianGermanGerman RussianGhanaianGreekGuamanian/ChamorroGuatemalanGuyaneseHaitianHmongHonduranHopiHoumaHungarianIcelanderIndian (Asian)IndonesianInupiatIranianIraqiIrishIroquoisIsraeliItalianJamaicanJapaneseJordanianKenyanKiowaKoreanLaotianLatvianLebaneseLiberianLithuanianLumbeeLuxembourgerMacedonianMalaysianMalteseMarshalleseMenomineeMexicanMexican American IndianMongolianMoroccanNative HawaiianNavajoNepaleseNew ZealanderNicaraguanNigerianNorthern EuropeanNorwegianOkinawanOsageOttawaPaiutePakistaniPalestinianPanamanianParaguayanPennsylvania GermanPeruvianPimaPolishPortuguesePotawatomiPuebloPuerto RicanPuget Sound SalishRomanianRussianSalvadoranSamoanScandinavianScotch-IrishScottishSeminoleSenegaleseSerbianShoshoneSierra LeoneanSiouxSlavicSlovakSloveneSomaliSouth AfricanSouth AmericanSouth American IndianSoviet UnionSpaniardSpanishSpanish AmericanSpanish American IndianSri LankanSubsaharan AfricanSudaneseSwedishSwissSyrianTaiwaneseThaiTlingit-HaidaTohono O'OdhamTonganTrinidadian and TobagonianTsimshianTurkishU.S. Virgin IslanderUgandanUkrainianUruguayanUteVenezuelanVietnameseWelshWest IndianYakamaYugoslavianYumanYup'ikZimbabwean
Immigration
NonimmigrantsImmigrantsAfghanistanAfricaAlbaniaArgentinaArmeniaAsiaAustraliaAustriaBahamasBangladeshBarbadosBelarusBelgiumBelizeBoliviaBosnia and HerzegovinaBrazilBulgariaBurma/MyanmarCabo VerdeCambodiaCameroonCanadaCaribbeanCentral AmericaChileChinaColombiaCongoCosta RicaCroatiaCubaCzechoslovakiaDenmarkDominicaDominican RepublicEastern AfricaEastern AsiaEastern EuropeEcuadorEgyptEl SalvadorEnglandEritreaEthiopiaEuropeFijiFranceGermanyGhanaGreeceGrenadaGuatemalaGuyanaHaitiHondurasHong KongHungaryIndiaIndonesiaIranIraqIrelandIsraelItalyJamaicaJapanJordanKazakhstanKenyaKoreaKuwaitLaosLatin AmericaLatviaLebanonLiberiaLithuaniaMalaysiaMexicoMicronesiaMiddle AfricaMoldovaMoroccoNepalNetherlandsNicaraguaNigeriaNorth AmericaNorth MacedoniaNorthern AfricaNorthern EuropeNorwayOceaniaPakistanPanamaPeruPhilippinesPolandPortugalRomaniaRussiaSaudi ArabiaScotlandSenegalSerbiaSierra LeoneSingaporeSomaliaSouth AfricaSouth AmericaSouth Central AsiaSouth Eastern AsiaSouthern EuropeSpainSri LankaSt. Vincent and the GrenadinesSudanSwedenSwitzerlandSyriaTaiwanThailandTrinidad and TobagoTurkeyUgandaUkraineUruguayUzbekistanVenezuelaVietnamWest IndiesWestern AfricaWestern AsiaWestern EuropeYemenZaireZimbabweAzores
Married-Couple Family Poverty
Income
Poverty
Unemployment
Labor Participation
Family Structure
Vehicle Availability
Education Level
Disability

Yaqui Married-Couple Family Poverty
Tragic

6.3%
POVERTY | MARRIED-COUPLE FAMILIES
0.1/ 100
METRIC RATING
276th/ 347
METRIC RANK

Yaqui Married-Couple Family Poverty Correlation Chart

The statistical analysis conducted on geographies consisting of 107,553,636 people shows a poor negative correlation between the proportion of Yaqui and poverty level among married-couple families in the United States with a correlation coefficient (R) of -0.183 and weighted average of 6.3%. On average, for every 1% (one percent) increase in Yaqui within a typical geography, there is a decrease of 0.17% in poverty level among married-couple families.
Yaqui Married-Couple Family Poverty
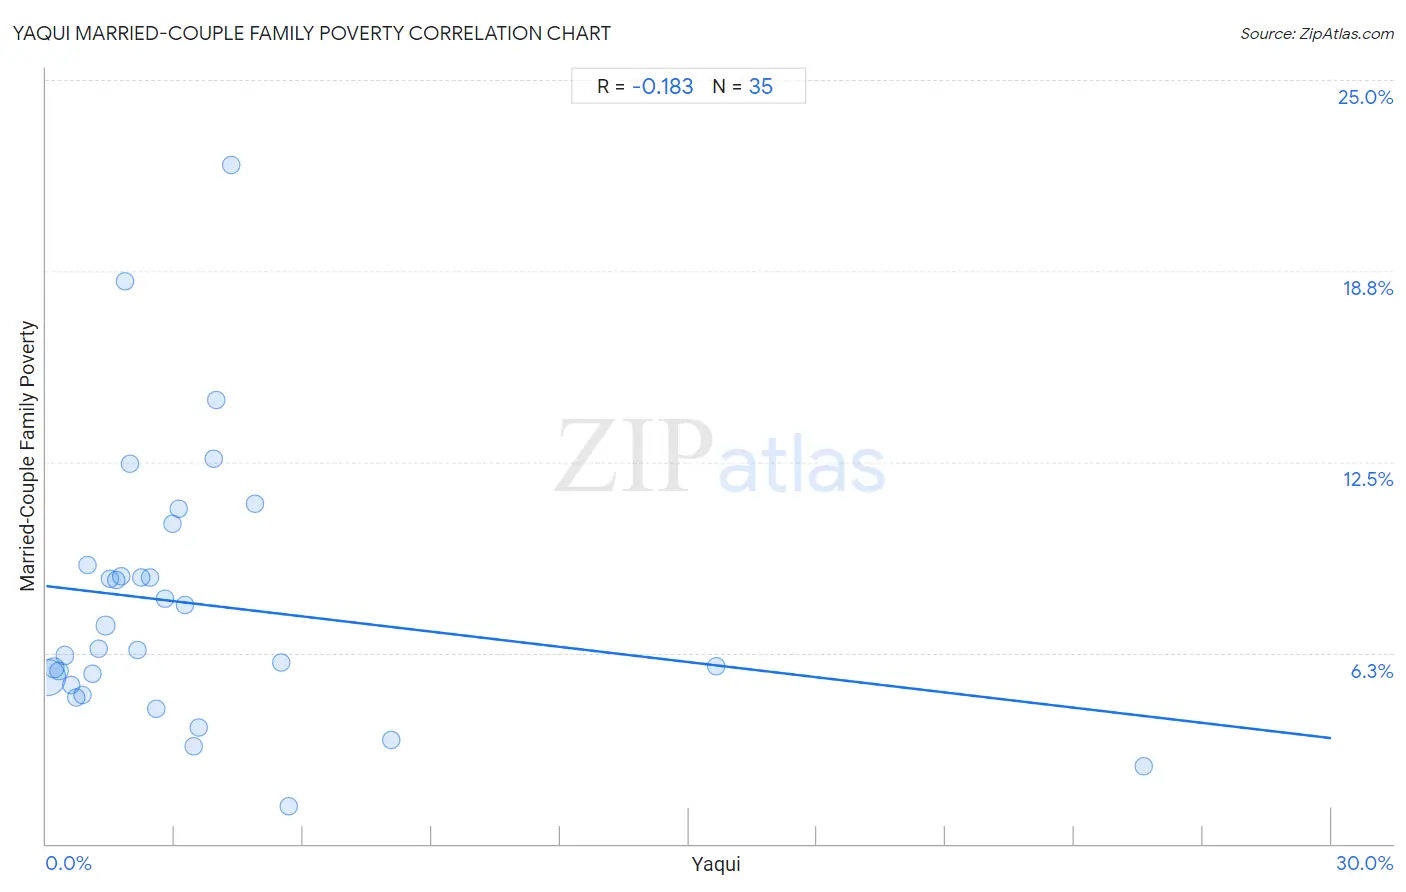
It is essential to understand that the correlation between the percentage of Yaqui and poverty level among married-couple families does not imply a direct cause-and-effect relationship. It remains uncertain whether the presence of Yaqui influences an upward or downward trend in the level of poverty level among married-couple families within an area, or if Yaqui simply ended up residing in those areas with higher or lower levels of poverty level among married-couple families due to other factors.

Demographics Similar to Yaqui by Married-Couple Family Poverty

In terms of married-couple family poverty, the demographic groups most similar to Yaqui are Indonesian (6.3%, a difference of 0.14%), Choctaw (6.3%, a difference of 0.45%), Barbadian (6.3%, a difference of 0.62%), Immigrants from Trinidad and Tobago (6.4%, a difference of 0.62%), and Colville (6.3%, a difference of 0.66%).
DemographicsRating | RankMarried-Couple Family Poverty
Immigrants from West Indies
0.1
/100
|
#269
Tragic
6.2%
Immigrants from Jamaica
0.1
/100
|
#270
Tragic
6.2%
Immigrants from Bahamas
0.1
/100
|
#271
Tragic
6.2%
Trinidadians and Tobagonians
0.1
/100
|
#272
Tragic
6.2%
Colville
0.1
/100
|
#273
Tragic
6.3%
Barbadians
0.1
/100
|
#274
Tragic
6.3%
Choctaw
0.1
/100
|
#275
Tragic
6.3%
Yaqui
0.1
/100
|
#276
Tragic
6.3%
Indonesians
0.1
/100
|
#277
Tragic
6.3%
Immigrants from Trinidad and Tobago
0.1
/100
|
#278
Tragic
6.4%
Houma
0.0
/100
|
#279
Tragic
6.4%
West Indians
0.0
/100
|
#280
Tragic
6.4%
Mexican American Indians
0.0
/100
|
#281
Tragic
6.4%
Seminole
0.0
/100
|
#282
Tragic
6.4%
Ute
0.0
/100
|
#283
Tragic
6.4%

Yaqui Married-Couple Family Poverty Correlation Summary

MeasurementYaqui DataMarried-Couple Family Poverty Data
Minimum0.033%1.2%
Maximum25.6%22.2%
Range25.6%21.0%
Mean3.5%7.9%
Median2.2%6.4%
Interquartile 25% (IQ1)1.1%5.2%
Interquartile 75% (IQ3)3.9%9.1%
Interquartile Range (IQR)2.8%3.9%
Standard Deviation (Sample)4.8%4.3%
Standard Deviation (Population)4.7%4.3%

Correlation Details

Yaqui PercentileSample SizeMarried-Couple Family Poverty
[
0.0%
-
0.5%
]
0.033%
90,864,7125.5%
[
0.0%
-
0.5%
]
0.18%
9,585,1185.8%
[
0.0%
-
0.5%
]
0.30%
2,963,8445.7%
[
0.0%
-
0.5%
]
0.44%
1,573,2106.2%
[
0.5%
-
1.0%
]
0.58%
415,5355.2%
[
0.5%
-
1.0%
]
0.69%
328,4784.8%
[
0.5%
-
1.0%
]
0.83%
299,3384.9%
[
0.5%
-
1.0%
]
0.96%
217,0709.1%
[
1.0%
-
1.5%
]
1.08%
79,6325.6%
[
1.0%
-
1.5%
]
1.22%
158,6346.4%
[
1.0%
-
1.5%
]
1.39%
583,7577.1%
[
1.0%
-
1.5%
]
1.48%
25,7028.7%
[
1.5%
-
2.0%
]
1.65%
6,0668.6%
[
1.5%
-
2.0%
]
1.76%
16,8238.7%
[
1.5%
-
2.0%
]
1.83%
61,13918.4%
[
1.5%
-
2.0%
]
1.97%
5,74212.4%
[
2.0%
-
2.5%
]
2.13%
23,5596.3%
[
2.0%
-
2.5%
]
2.21%
95,7528.7%
[
2.0%
-
2.5%
]
2.41%
35,9218.7%
[
2.5%
-
3.0%
]
2.56%
6264.4%
[
2.5%
-
3.0%
]
2.78%
1448.0%
[
2.5%
-
3.0%
]
2.94%
6,57110.5%
[
3.0%
-
3.5%
]
3.08%
6,26011.0%
[
3.0%
-
3.5%
]
3.23%
36,8287.8%
[
3.0%
-
3.5%
]
3.43%
3793.2%
[
3.5%
-
4.0%
]
3.55%
45,7393.8%
[
3.5%
-
4.0%
]
3.90%
15,90912.6%
[
3.5%
-
4.0%
]
3.98%
57,89714.5%
[
4.0%
-
4.5%
]
4.31%
5,12522.2%
[
4.5%
-
5.0%
]
4.87%
1,06711.1%
[
5.0%
-
5.5%
]
5.49%
5,1005.9%
[
5.5%
-
6.0%
]
5.65%
4,3371.2%
[
8.0%
-
8.5%
]
8.06%
1,2663.4%
[
15.5%
-
16.0%
]
15.65%
21,0215.8%
[
25.5%
-
26.0%
]
25.62%
5,3352.5%