Yaqui GED/Equivalency
COMPARE
Yaqui
Select to Compare
GED/Equivalency
Yaqui GED/Equivalency
80.5%
GED/EQUIVALENCY
0.0/ 100
METRIC RATING
318th/ 347
METRIC RANK
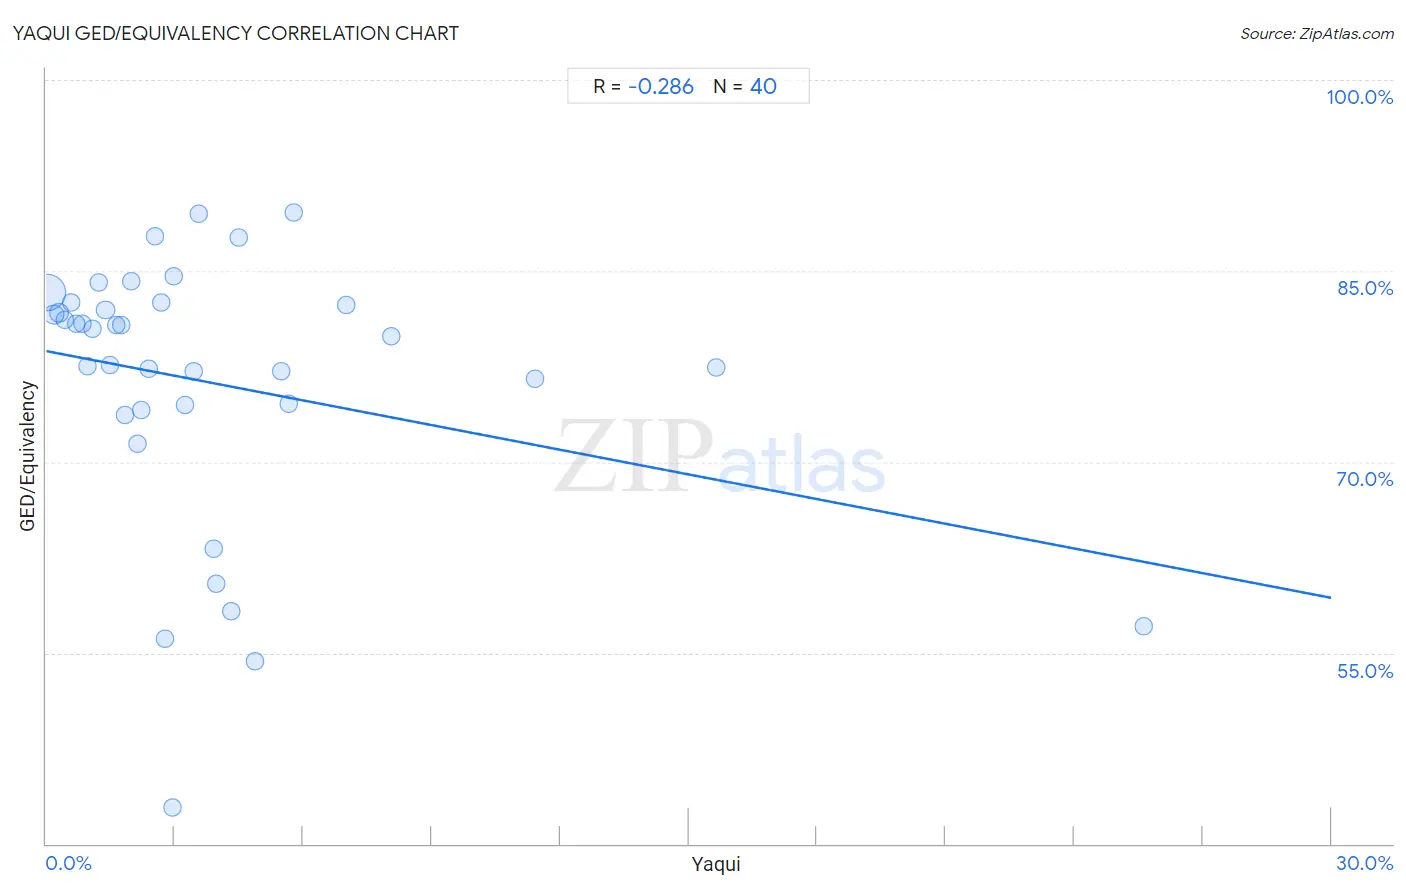
Yaqui GED/Equivalency Correlation Chart
The statistical analysis conducted on geographies consisting of 107,732,380 people shows a weak negative correlation between the proportion of Yaqui and percentage of population with at least ged/equivalency education in the United States with a correlation coefficient (R) of -0.286 and weighted average of 80.5%. On average, for every 1% (one percent) increase in Yaqui within a typical geography, there is a decrease of 0.65% in percentage of population with at least ged/equivalency education.
It is essential to understand that the correlation between the percentage of Yaqui and percentage of population with at least ged/equivalency education does not imply a direct cause-and-effect relationship. It remains uncertain whether the presence of Yaqui influences an upward or downward trend in the level of percentage of population with at least ged/equivalency education within an area, or if Yaqui simply ended up residing in those areas with higher or lower levels of percentage of population with at least ged/equivalency education due to other factors.
Demographics Similar to Yaqui by GED/Equivalency
In terms of ged/equivalency, the demographic groups most similar to Yaqui are Immigrants from Belize (80.5%, a difference of 0.0%), Immigrants from Caribbean (80.5%, a difference of 0.020%), Central American Indian (80.6%, a difference of 0.13%), Apache (80.7%, a difference of 0.26%), and Immigrants from Cuba (80.2%, a difference of 0.41%).
| Demographics | Rating | Rank | GED/Equivalency |
| Natives/Alaskans | 0.0 /100 | #311 | Tragic 80.9% |
| Nicaraguans | 0.0 /100 | #312 | Tragic 80.9% |
| Cape Verdeans | 0.0 /100 | #313 | Tragic 80.9% |
| Belizeans | 0.0 /100 | #314 | Tragic 80.9% |
| Apache | 0.0 /100 | #315 | Tragic 80.7% |
| Central American Indians | 0.0 /100 | #316 | Tragic 80.6% |
| Immigrants from Caribbean | 0.0 /100 | #317 | Tragic 80.5% |
| Yaqui | 0.0 /100 | #318 | Tragic 80.5% |
| Immigrants from Belize | 0.0 /100 | #319 | Tragic 80.5% |
| Immigrants from Cuba | 0.0 /100 | #320 | Tragic 80.2% |
| Yup'ik | 0.0 /100 | #321 | Tragic 80.0% |
| Lumbee | 0.0 /100 | #322 | Tragic 80.0% |
| Immigrants from Nicaragua | 0.0 /100 | #323 | Tragic 79.9% |
| Mexican American Indians | 0.0 /100 | #324 | Tragic 79.4% |
| Hondurans | 0.0 /100 | #325 | Tragic 79.3% |
Yaqui GED/Equivalency Correlation Summary
| Measurement | Yaqui Data | GED/Equivalency Data |
| Minimum | 0.033% | 42.9% |
| Maximum | 25.6% | 89.6% |
| Range | 25.6% | 46.7% |
| Mean | 3.8% | 76.2% |
| Median | 2.6% | 80.2% |
| Interquartile 25% (IQ1) | 1.3% | 74.3% |
| Interquartile 75% (IQ3) | 4.4% | 82.4% |
| Interquartile Range (IQR) | 3.1% | 8.1% |
| Standard Deviation (Sample) | 4.7% | 10.6% |
| Standard Deviation (Population) | 4.6% | 10.4% |
Correlation Details
| Yaqui Percentile | Sample Size | GED/Equivalency |
[ 0.0% - 0.5% ] 0.033% | 90,909,943 | 83.3% |
[ 0.0% - 0.5% ] 0.18% | 9,597,431 | 81.6% |
[ 0.0% - 0.5% ] 0.30% | 2,981,801 | 81.7% |
[ 0.0% - 0.5% ] 0.44% | 1,588,650 | 81.1% |
[ 0.5% - 1.0% ] 0.58% | 441,369 | 82.5% |
[ 0.5% - 1.0% ] 0.69% | 359,857 | 80.9% |
[ 0.5% - 1.0% ] 0.83% | 303,432 | 80.9% |
[ 0.5% - 1.0% ] 0.96% | 224,714 | 77.5% |
[ 1.0% - 1.5% ] 1.08% | 80,731 | 80.4% |
[ 1.0% - 1.5% ] 1.22% | 162,236 | 84.1% |
[ 1.0% - 1.5% ] 1.39% | 585,535 | 81.9% |
[ 1.0% - 1.5% ] 1.48% | 25,702 | 77.6% |
[ 1.5% - 2.0% ] 1.65% | 6,066 | 80.7% |
[ 1.5% - 2.0% ] 1.75% | 22,202 | 80.8% |
[ 1.5% - 2.0% ] 1.83% | 61,139 | 73.6% |
[ 1.5% - 2.0% ] 1.97% | 8,068 | 84.2% |
[ 2.0% - 2.5% ] 2.13% | 24,899 | 71.4% |
[ 2.0% - 2.5% ] 2.21% | 96,191 | 74.1% |
[ 2.0% - 2.5% ] 2.41% | 36,650 | 77.3% |
[ 2.5% - 3.0% ] 2.55% | 784 | 87.8% |
[ 2.5% - 3.0% ] 2.68% | 1,454 | 82.5% |
[ 2.5% - 3.0% ] 2.78% | 144 | 56.1% |
[ 2.5% - 3.0% ] 2.94% | 7,359 | 42.9% |
[ 2.5% - 3.0% ] 2.96% | 2,936 | 84.6% |
[ 3.0% - 3.5% ] 3.23% | 36,828 | 74.5% |
[ 3.0% - 3.5% ] 3.43% | 379 | 77.2% |
[ 3.5% - 4.0% ] 3.55% | 45,881 | 89.5% |
[ 3.5% - 4.0% ] 3.90% | 15,909 | 63.1% |
[ 3.5% - 4.0% ] 3.98% | 57,897 | 60.5% |
[ 4.0% - 4.5% ] 4.31% | 5,125 | 58.3% |
[ 4.0% - 4.5% ] 4.50% | 1,845 | 87.7% |
[ 4.5% - 5.0% ] 4.87% | 1,067 | 54.3% |
[ 5.0% - 5.5% ] 5.49% | 5,574 | 77.1% |
[ 5.5% - 6.0% ] 5.65% | 4,337 | 74.6% |
[ 5.5% - 6.0% ] 5.77% | 52 | 89.6% |
[ 7.0% - 7.5% ] 7.00% | 457 | 82.3% |
[ 8.0% - 8.5% ] 8.06% | 1,266 | 79.9% |
[ 11.0% - 11.5% ] 11.40% | 114 | 76.6% |
[ 15.5% - 16.0% ] 15.65% | 21,021 | 77.4% |
[ 25.5% - 26.0% ] 25.62% | 5,335 | 57.1% |