Yaqui College, 1 year or more

COMPARE

Yaqui
Race
Ancestry
AfghanAfricanAlaska NativeAlaskan AthabascanAlbanianAleutAlsatianAmericanApacheArabArapahoArgentineanArmenianAssyrian/Chaldean/SyriacAustralianAustrianBahamianBangladeshiBarbadianBasqueBelgianBelizeanBermudanBhutaneseBlackfeetBolivianBrazilianBritishBritish West IndianBulgarianBurmeseCajunCambodianCanadianCape VerdeanCarpatho RusynCelticCentral AmericanCentral American IndianCherokeeCheyenneChickasawChileanChineseChippewaChoctawColombianColvilleComancheCosta RicanCreeCreekCroatianCrowCubanCypriotCzechCzechoslovakianDanishDelawareDominicanDutchDutch West IndianEastern EuropeanEcuadorianEgyptianEnglishEstonianEthiopianEuropeanFijianFilipinoFinnishFrenchFrench American IndianFrench CanadianGermanGerman RussianGhanaianGreekGuamanian/ChamorroGuatemalanGuyaneseHaitianHmongHonduranHopiHoumaHungarianIcelanderIndian (Asian)IndonesianInupiatIranianIraqiIrishIroquoisIsraeliItalianJamaicanJapaneseJordanianKenyanKiowaKoreanLaotianLatvianLebaneseLiberianLithuanianLumbeeLuxembourgerMacedonianMalaysianMalteseMarshalleseMenomineeMexicanMexican American IndianMongolianMoroccanNative HawaiianNavajoNepaleseNew ZealanderNicaraguanNigerianNorthern EuropeanNorwegianOkinawanOsageOttawaPaiutePakistaniPalestinianPanamanianParaguayanPennsylvania GermanPeruvianPimaPolishPortuguesePotawatomiPuebloPuerto RicanPuget Sound SalishRomanianRussianSalvadoranSamoanScandinavianScotch-IrishScottishSeminoleSenegaleseSerbianShoshoneSierra LeoneanSiouxSlavicSlovakSloveneSomaliSouth AfricanSouth AmericanSouth American IndianSoviet UnionSpaniardSpanishSpanish AmericanSpanish American IndianSri LankanSubsaharan AfricanSudaneseSwedishSwissSyrianTaiwaneseThaiTlingit-HaidaTohono O'OdhamTonganTrinidadian and TobagonianTsimshianTurkishU.S. Virgin IslanderUgandanUkrainianUruguayanUteVenezuelanVietnameseWelshWest IndianYakamaYaquiYugoslavianYumanYup'ikZimbabwean
Immigration
NonimmigrantsImmigrantsAfghanistanAfricaAlbaniaArgentinaArmeniaAsiaAustraliaAustriaBahamasBangladeshBarbadosBelarusBelgiumBelizeBoliviaBosnia and HerzegovinaBrazilBulgariaBurma/MyanmarCabo VerdeCambodiaCameroonCanadaCaribbeanCentral AmericaChileChinaColombiaCongoCosta RicaCroatiaCubaCzechoslovakiaDenmarkDominicaDominican RepublicEastern AfricaEastern AsiaEastern EuropeEcuadorEgyptEl SalvadorEnglandEritreaEthiopiaEuropeFijiFranceGermanyGhanaGreeceGrenadaGuatemalaGuyanaHaitiHondurasHong KongHungaryIndiaIndonesiaIranIraqIrelandIsraelItalyJamaicaJapanJordanKazakhstanKenyaKoreaKuwaitLaosLatin AmericaLatviaLebanonLiberiaLithuaniaMalaysiaMexicoMicronesiaMiddle AfricaMoldovaMoroccoNepalNetherlandsNicaraguaNigeriaNorth AmericaNorth MacedoniaNorthern AfricaNorthern EuropeNorwayOceaniaPakistanPanamaPeruPhilippinesPolandPortugalRomaniaRussiaSaudi ArabiaScotlandSenegalSerbiaSierra LeoneSingaporeSomaliaSouth AfricaSouth AmericaSouth Central AsiaSouth Eastern AsiaSouthern EuropeSpainSri LankaSt. Vincent and the GrenadinesSudanSwedenSwitzerlandSyriaTaiwanThailandTrinidad and TobagoTurkeyUgandaUkraineUruguayUzbekistanVenezuelaVietnamWest IndiesWestern AfricaWestern AsiaWestern EuropeYemenZaireZimbabweAzores
Select to Compare
Race
Ancestry
AfghanAfricanAlaska NativeAlaskan AthabascanAlbanianAleutAlsatianAmericanApacheArabArapahoArgentineanArmenianAssyrian/Chaldean/SyriacAustralianAustrianBahamianBangladeshiBarbadianBasqueBelgianBelizeanBermudanBhutaneseBlackfeetBolivianBrazilianBritishBritish West IndianBulgarianBurmeseCajunCambodianCanadianCape VerdeanCarpatho RusynCelticCentral AmericanCentral American IndianCherokeeCheyenneChickasawChileanChineseChippewaChoctawColombianColvilleComancheCosta RicanCreeCreekCroatianCrowCubanCypriotCzechCzechoslovakianDanishDelawareDominicanDutchDutch West IndianEastern EuropeanEcuadorianEgyptianEnglishEstonianEthiopianEuropeanFijianFilipinoFinnishFrenchFrench American IndianFrench CanadianGermanGerman RussianGhanaianGreekGuamanian/ChamorroGuatemalanGuyaneseHaitianHmongHonduranHopiHoumaHungarianIcelanderIndian (Asian)IndonesianInupiatIranianIraqiIrishIroquoisIsraeliItalianJamaicanJapaneseJordanianKenyanKiowaKoreanLaotianLatvianLebaneseLiberianLithuanianLumbeeLuxembourgerMacedonianMalaysianMalteseMarshalleseMenomineeMexicanMexican American IndianMongolianMoroccanNative HawaiianNavajoNepaleseNew ZealanderNicaraguanNigerianNorthern EuropeanNorwegianOkinawanOsageOttawaPaiutePakistaniPalestinianPanamanianParaguayanPennsylvania GermanPeruvianPimaPolishPortuguesePotawatomiPuebloPuerto RicanPuget Sound SalishRomanianRussianSalvadoranSamoanScandinavianScotch-IrishScottishSeminoleSenegaleseSerbianShoshoneSierra LeoneanSiouxSlavicSlovakSloveneSomaliSouth AfricanSouth AmericanSouth American IndianSoviet UnionSpaniardSpanishSpanish AmericanSpanish American IndianSri LankanSubsaharan AfricanSudaneseSwedishSwissSyrianTaiwaneseThaiTlingit-HaidaTohono O'OdhamTonganTrinidadian and TobagonianTsimshianTurkishU.S. Virgin IslanderUgandanUkrainianUruguayanUteVenezuelanVietnameseWelshWest IndianYakamaYugoslavianYumanYup'ikZimbabwean
Immigration
NonimmigrantsImmigrantsAfghanistanAfricaAlbaniaArgentinaArmeniaAsiaAustraliaAustriaBahamasBangladeshBarbadosBelarusBelgiumBelizeBoliviaBosnia and HerzegovinaBrazilBulgariaBurma/MyanmarCabo VerdeCambodiaCameroonCanadaCaribbeanCentral AmericaChileChinaColombiaCongoCosta RicaCroatiaCubaCzechoslovakiaDenmarkDominicaDominican RepublicEastern AfricaEastern AsiaEastern EuropeEcuadorEgyptEl SalvadorEnglandEritreaEthiopiaEuropeFijiFranceGermanyGhanaGreeceGrenadaGuatemalaGuyanaHaitiHondurasHong KongHungaryIndiaIndonesiaIranIraqIrelandIsraelItalyJamaicaJapanJordanKazakhstanKenyaKoreaKuwaitLaosLatin AmericaLatviaLebanonLiberiaLithuaniaMalaysiaMexicoMicronesiaMiddle AfricaMoldovaMoroccoNepalNetherlandsNicaraguaNigeriaNorth AmericaNorth MacedoniaNorthern AfricaNorthern EuropeNorwayOceaniaPakistanPanamaPeruPhilippinesPolandPortugalRomaniaRussiaSaudi ArabiaScotlandSenegalSerbiaSierra LeoneSingaporeSomaliaSouth AfricaSouth AmericaSouth Central AsiaSouth Eastern AsiaSouthern EuropeSpainSri LankaSt. Vincent and the GrenadinesSudanSwedenSwitzerlandSyriaTaiwanThailandTrinidad and TobagoTurkeyUgandaUkraineUruguayUzbekistanVenezuelaVietnamWest IndiesWestern AfricaWestern AsiaWestern EuropeYemenZaireZimbabweAzores
College, 1 year or more
Income
Poverty
Unemployment
Labor Participation
Family Structure
Vehicle Availability
Education Level
Disability

Yaqui College, 1 year or more
Tragic

53.2%
COLLEGE, 1 YEAR OR MORE
0.0/ 100
METRIC RATING
295th/ 347
METRIC RANK

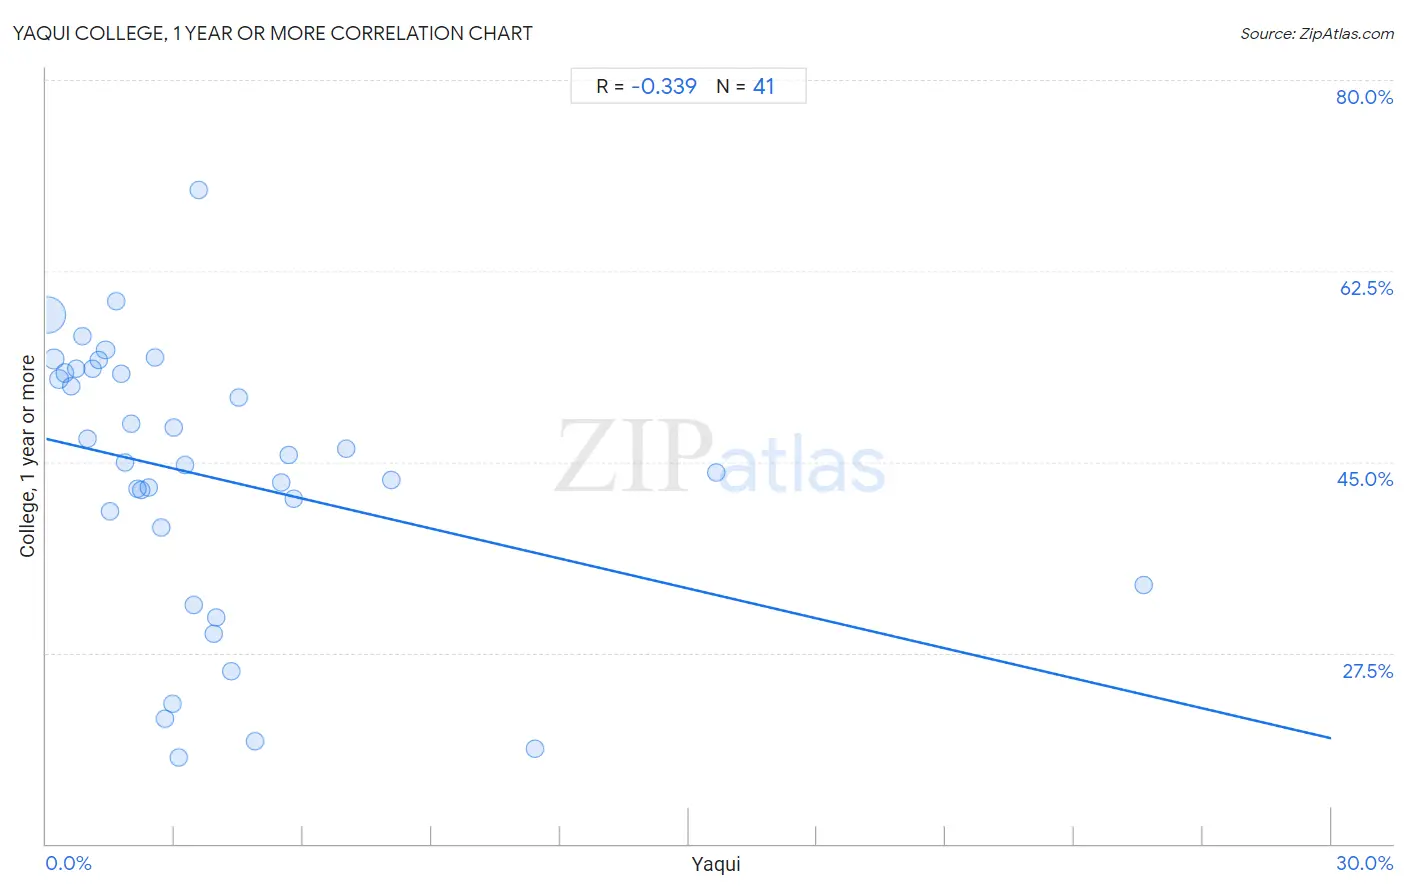
Yaqui College, 1 year or more Correlation Chart

The statistical analysis conducted on geographies consisting of 107,738,640 people shows a mild negative correlation between the proportion of Yaqui and percentage of population with at least college, 1 year or more education in the United States with a correlation coefficient (R) of -0.339 and weighted average of 53.2%. On average, for every 1% (one percent) increase in Yaqui within a typical geography, there is a decrease of 0.92% in percentage of population with at least college, 1 year or more education.
Yaqui College, 1 year or more
It is essential to understand that the correlation between the percentage of Yaqui and percentage of population with at least college, 1 year or more education does not imply a direct cause-and-effect relationship. It remains uncertain whether the presence of Yaqui influences an upward or downward trend in the level of percentage of population with at least college, 1 year or more education within an area, or if Yaqui simply ended up residing in those areas with higher or lower levels of percentage of population with at least college, 1 year or more education due to other factors.

Demographics Similar to Yaqui by College, 1 year or more

In terms of college, 1 year or more, the demographic groups most similar to Yaqui are Cherokee (53.2%, a difference of 0.010%), Black/African American (53.3%, a difference of 0.23%), Chickasaw (53.3%, a difference of 0.25%), Sioux (53.0%, a difference of 0.34%), and Cuban (53.4%, a difference of 0.38%).
DemographicsRating | RankCollege, 1 year or more
Alaska Natives
0.0
/100
|
#288
Tragic
53.4%
Immigrants from Ecuador
0.0
/100
|
#289
Tragic
53.4%
Alaskan Athabascans
0.0
/100
|
#290
Tragic
53.4%
Cubans
0.0
/100
|
#291
Tragic
53.4%
Chickasaw
0.0
/100
|
#292
Tragic
53.3%
Blacks/African Americans
0.0
/100
|
#293
Tragic
53.3%
Cherokee
0.0
/100
|
#294
Tragic
53.2%
Yaqui
0.0
/100
|
#295
Tragic
53.2%
Sioux
0.0
/100
|
#296
Tragic
53.0%
Paiute
0.0
/100
|
#297
Tragic
52.9%
Immigrants from Dominica
0.0
/100
|
#298
Tragic
52.5%
Immigrants from Nicaragua
0.0
/100
|
#299
Tragic
52.4%
Choctaw
0.0
/100
|
#300
Tragic
52.3%
Haitians
0.0
/100
|
#301
Tragic
52.3%
Puerto Ricans
0.0
/100
|
#302
Tragic
52.2%

Yaqui College, 1 year or more Correlation Summary

MeasurementYaqui DataCollege, 1 year or more Data
Minimum0.033%17.9%
Maximum25.6%69.9%
Range25.6%52.0%
Mean3.8%43.6%
Median2.7%45.0%
Interquartile 25% (IQ1)1.3%36.3%
Interquartile 75% (IQ3)4.4%53.3%
Interquartile Range (IQR)3.1%17.0%
Standard Deviation (Sample)4.6%12.5%
Standard Deviation (Population)4.6%12.3%

Correlation Details

Yaqui PercentileSample SizeCollege, 1 year or more
[
0.0%
-
0.5%
]
0.033%
90,909,94358.5%
[
0.0%
-
0.5%
]
0.18%
9,597,43154.5%
[
0.0%
-
0.5%
]
0.30%
2,981,80152.6%
[
0.0%
-
0.5%
]
0.44%
1,588,65053.1%
[
0.5%
-
1.0%
]
0.58%
441,36951.9%
[
0.5%
-
1.0%
]
0.69%
359,85753.5%
[
0.5%
-
1.0%
]
0.83%
303,43256.5%
[
0.5%
-
1.0%
]
0.96%
224,71447.1%
[
1.0%
-
1.5%
]
1.08%
80,73153.5%
[
1.0%
-
1.5%
]
1.22%
162,23654.3%
[
1.0%
-
1.5%
]
1.39%
585,53555.3%
[
1.0%
-
1.5%
]
1.48%
25,70240.5%
[
1.5%
-
2.0%
]
1.65%
6,06659.8%
[
1.5%
-
2.0%
]
1.75%
22,20253.0%
[
1.5%
-
2.0%
]
1.83%
61,13945.0%
[
1.5%
-
2.0%
]
1.97%
8,06848.5%
[
2.0%
-
2.5%
]
2.13%
24,89942.5%
[
2.0%
-
2.5%
]
2.21%
96,19142.4%
[
2.0%
-
2.5%
]
2.41%
36,65042.6%
[
2.5%
-
3.0%
]
2.55%
78454.6%
[
2.5%
-
3.0%
]
2.68%
1,45439.0%
[
2.5%
-
3.0%
]
2.78%
14421.4%
[
2.5%
-
3.0%
]
2.94%
7,35922.8%
[
2.5%
-
3.0%
]
2.96%
2,93648.1%
[
3.0%
-
3.5%
]
3.08%
6,26017.9%
[
3.0%
-
3.5%
]
3.23%
36,82844.7%
[
3.0%
-
3.5%
]
3.43%
37931.8%
[
3.5%
-
4.0%
]
3.55%
45,88169.9%
[
3.5%
-
4.0%
]
3.90%
15,90929.3%
[
3.5%
-
4.0%
]
3.98%
57,89730.8%
[
4.0%
-
4.5%
]
4.31%
5,12525.8%
[
4.0%
-
4.5%
]
4.50%
1,84550.9%
[
4.5%
-
5.0%
]
4.87%
1,06719.4%
[
5.0%
-
5.5%
]
5.49%
5,57443.2%
[
5.5%
-
6.0%
]
5.65%
4,33745.6%
[
5.5%
-
6.0%
]
5.77%
5241.7%
[
7.0%
-
7.5%
]
7.00%
45746.2%
[
8.0%
-
8.5%
]
8.06%
1,26643.4%
[
11.0%
-
11.5%
]
11.40%
11418.8%
[
15.5%
-
16.0%
]
15.65%
21,02144.0%
[
25.5%
-
26.0%
]
25.62%
5,33533.7%