Yakama 1 or more Vehicles in Household
COMPARE
Yakama
Select to Compare
1 or more Vehicles in Household
Yakama 1 or more Vehicles in Household
93.6%
1+ VEHICLES AVAILABLE
100.0/ 100
METRIC RATING
5th/ 347
METRIC RANK
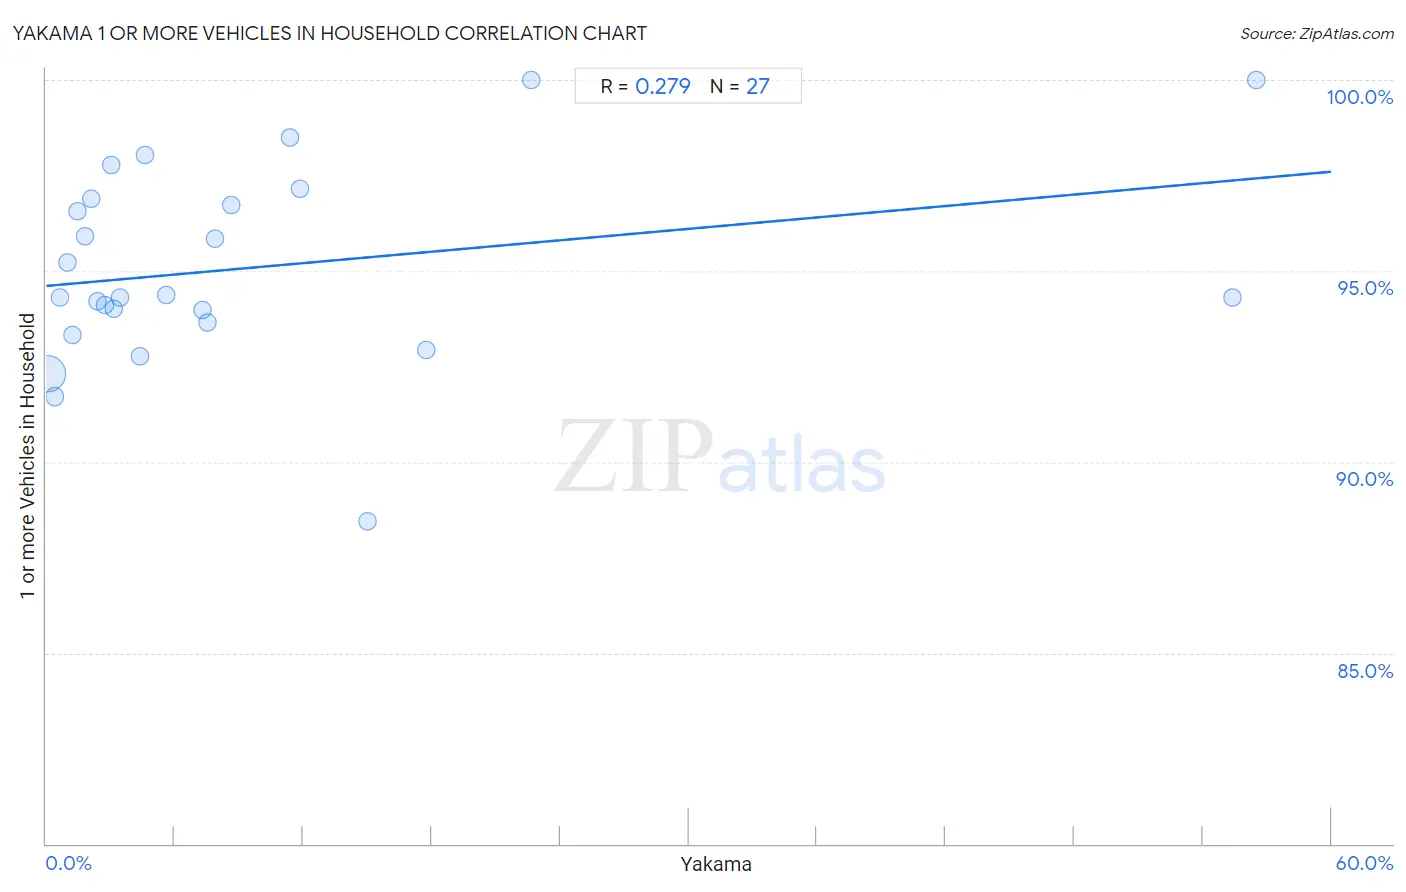
Yakama 1 or more Vehicles in Household Correlation Chart
The statistical analysis conducted on geographies consisting of 19,917,879 people shows a weak positive correlation between the proportion of Yakama and percentage of households with 1 or more vehicles available in the United States with a correlation coefficient (R) of 0.279 and weighted average of 93.6%. On average, for every 1% (one percent) increase in Yakama within a typical geography, there is an increase of 0.050% in percentage of households with 1 or more vehicles available.
It is essential to understand that the correlation between the percentage of Yakama and percentage of households with 1 or more vehicles available does not imply a direct cause-and-effect relationship. It remains uncertain whether the presence of Yakama influences an upward or downward trend in the level of percentage of households with 1 or more vehicles available within an area, or if Yakama simply ended up residing in those areas with higher or lower levels of percentage of households with 1 or more vehicles available due to other factors.
Demographics Similar to Yakama by 1 or more Vehicles in Household
In terms of 1 or more vehicles in household, the demographic groups most similar to Yakama are Danish (93.5%, a difference of 0.020%), German (93.6%, a difference of 0.10%), Norwegian (93.7%, a difference of 0.14%), Scottish (93.4%, a difference of 0.21%), and Swedish (93.3%, a difference of 0.25%).
| Demographics | Rating | Rank | 1 or more Vehicles in Household |
| Luxembourgers | 100.0 /100 | #1 | Exceptional 94.8% |
| English | 100.0 /100 | #2 | Exceptional 93.8% |
| Norwegians | 100.0 /100 | #3 | Exceptional 93.7% |
| Germans | 100.0 /100 | #4 | Exceptional 93.6% |
| Yakama | 100.0 /100 | #5 | Exceptional 93.6% |
| Danes | 100.0 /100 | #6 | Exceptional 93.5% |
| Scottish | 100.0 /100 | #7 | Exceptional 93.4% |
| Swedes | 100.0 /100 | #8 | Exceptional 93.3% |
| Scotch-Irish | 100.0 /100 | #9 | Exceptional 93.3% |
| Dutch | 100.0 /100 | #10 | Exceptional 93.3% |
| Czechs | 100.0 /100 | #11 | Exceptional 93.3% |
| Scandinavians | 100.0 /100 | #12 | Exceptional 93.1% |
| Whites/Caucasians | 100.0 /100 | #13 | Exceptional 93.1% |
| Irish | 100.0 /100 | #14 | Exceptional 93.1% |
| Mexicans | 100.0 /100 | #15 | Exceptional 93.0% |
Yakama 1 or more Vehicles in Household Correlation Summary
| Measurement | Yakama Data | 1 or more Vehicles in Household Data |
| Minimum | 0.033% | 88.5% |
| Maximum | 56.5% | 100.0% |
| Range | 56.5% | 11.5% |
| Mean | 9.6% | 95.1% |
| Median | 4.4% | 94.3% |
| Interquartile 25% (IQ1) | 1.8% | 93.6% |
| Interquartile 75% (IQ3) | 11.4% | 96.9% |
| Interquartile Range (IQR) | 9.6% | 3.2% |
| Standard Deviation (Sample) | 14.5% | 2.6% |
| Standard Deviation (Population) | 14.2% | 2.5% |
Correlation Details
| Yakama Percentile | Sample Size | 1 or more Vehicles in Household |
[ 0.0% - 0.5% ] 0.033% | 19,058,180 | 92.3% |
[ 0.0% - 0.5% ] 0.38% | 567,932 | 91.7% |
[ 0.5% - 1.0% ] 0.66% | 83,410 | 94.3% |
[ 0.5% - 1.0% ] 1.00% | 71,755 | 95.2% |
[ 1.0% - 1.5% ] 1.23% | 12,799 | 93.3% |
[ 1.0% - 1.5% ] 1.49% | 6,858 | 96.6% |
[ 1.5% - 2.0% ] 1.79% | 14,006 | 95.9% |
[ 2.0% - 2.5% ] 2.12% | 44,079 | 96.9% |
[ 2.0% - 2.5% ] 2.42% | 6,405 | 94.2% |
[ 2.5% - 3.0% ] 2.71% | 1,768 | 94.1% |
[ 3.0% - 3.5% ] 3.03% | 659 | 97.8% |
[ 3.0% - 3.5% ] 3.15% | 2,920 | 94.0% |
[ 3.0% - 3.5% ] 3.43% | 1,078 | 94.3% |
[ 4.0% - 4.5% ] 4.39% | 569 | 92.8% |
[ 4.5% - 5.0% ] 4.60% | 3,153 | 98.0% |
[ 5.5% - 6.0% ] 5.58% | 11,112 | 94.4% |
[ 7.0% - 7.5% ] 7.32% | 205 | 94.0% |
[ 7.5% - 8.0% ] 7.54% | 199 | 93.6% |
[ 7.5% - 8.0% ] 7.88% | 13,015 | 95.8% |
[ 8.5% - 9.0% ] 8.64% | 220 | 96.7% |
[ 11.0% - 11.5% ] 11.38% | 1,195 | 98.5% |
[ 11.5% - 12.0% ] 11.87% | 640 | 97.1% |
[ 15.0% - 15.5% ] 15.00% | 120 | 88.5% |
[ 17.5% - 18.0% ] 17.73% | 13,145 | 92.9% |
[ 22.5% - 23.0% ] 22.67% | 172 | 100.0% |
[ 55.0% - 55.5% ] 55.39% | 1,724 | 94.3% |
[ 56.5% - 57.0% ] 56.51% | 561 | 100.0% |