Yakama Female Disability
COMPARE
Yakama
Select to Compare
Female Disability
Yakama Female Disability
13.2%
DISABILITY | FEMALES
0.0/ 100
METRIC RATING
292nd/ 347
METRIC RANK
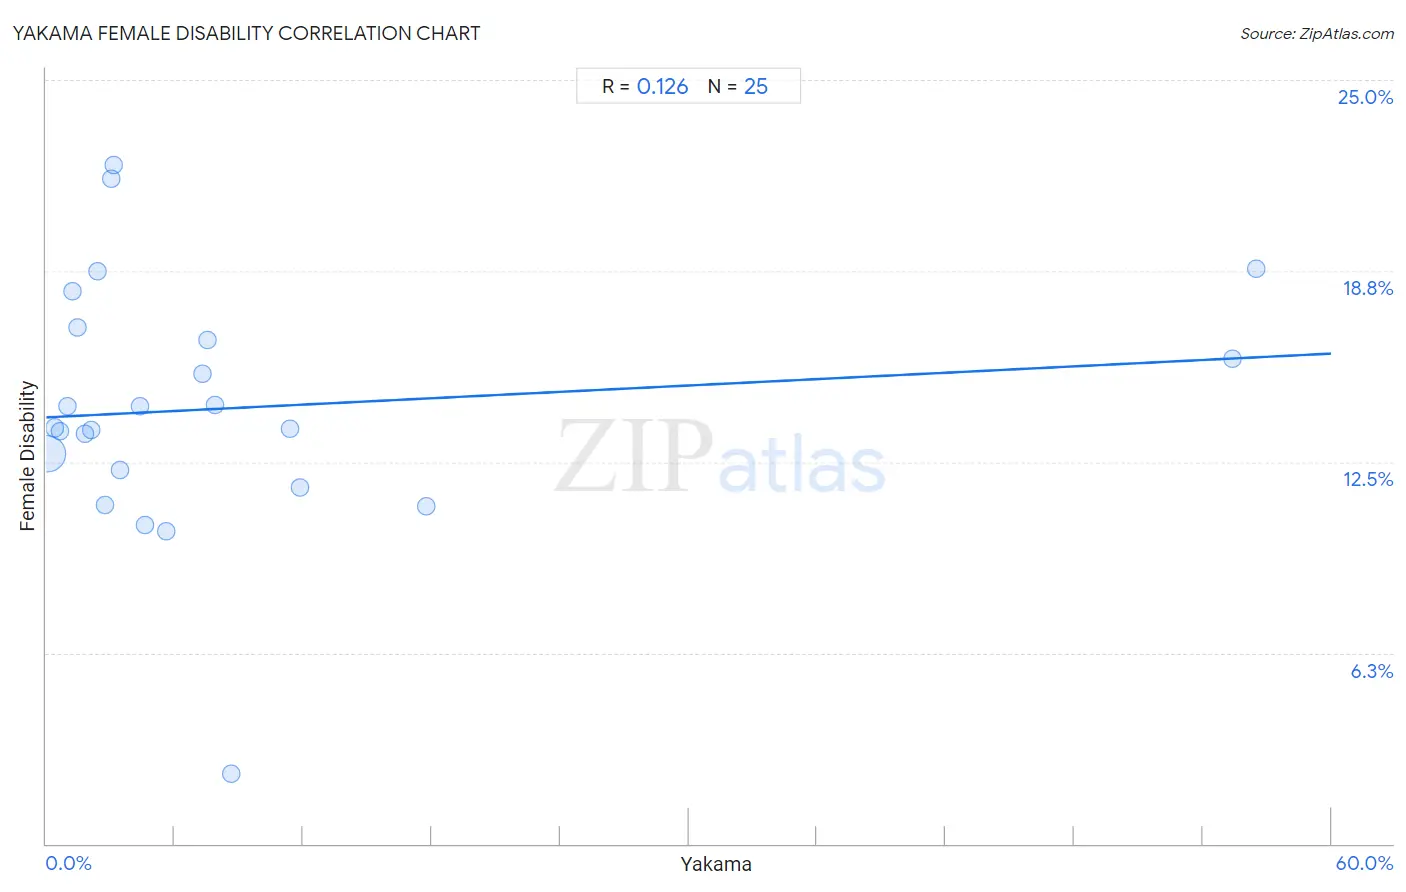
Yakama Female Disability Correlation Chart
The statistical analysis conducted on geographies consisting of 19,917,587 people shows a poor positive correlation between the proportion of Yakama and percentage of females with a disability in the United States with a correlation coefficient (R) of 0.126 and weighted average of 13.2%. On average, for every 1% (one percent) increase in Yakama within a typical geography, there is an increase of 0.035% in percentage of females with a disability.
It is essential to understand that the correlation between the percentage of Yakama and percentage of females with a disability does not imply a direct cause-and-effect relationship. It remains uncertain whether the presence of Yakama influences an upward or downward trend in the level of percentage of females with a disability within an area, or if Yakama simply ended up residing in those areas with higher or lower levels of percentage of females with a disability due to other factors.
Demographics Similar to Yakama by Female Disability
In terms of female disability, the demographic groups most similar to Yakama are Shoshone (13.2%, a difference of 0.17%), Tlingit-Haida (13.2%, a difference of 0.23%), Immigrants from Yemen (13.2%, a difference of 0.23%), Marshallese (13.3%, a difference of 0.26%), and Celtic (13.3%, a difference of 0.31%).
| Demographics | Rating | Rank | Female Disability |
| Bangladeshis | 0.0 /100 | #285 | Tragic 13.1% |
| Fijians | 0.0 /100 | #286 | Tragic 13.1% |
| Yaqui | 0.0 /100 | #287 | Tragic 13.2% |
| Whites/Caucasians | 0.0 /100 | #288 | Tragic 13.2% |
| Tlingit-Haida | 0.0 /100 | #289 | Tragic 13.2% |
| Immigrants from Yemen | 0.0 /100 | #290 | Tragic 13.2% |
| Shoshone | 0.0 /100 | #291 | Tragic 13.2% |
| Yakama | 0.0 /100 | #292 | Tragic 13.2% |
| Marshallese | 0.0 /100 | #293 | Tragic 13.3% |
| Celtics | 0.0 /100 | #294 | Tragic 13.3% |
| French | 0.0 /100 | #295 | Tragic 13.3% |
| Nepalese | 0.0 /100 | #296 | Tragic 13.3% |
| Slovaks | 0.0 /100 | #297 | Tragic 13.3% |
| Nonimmigrants | 0.0 /100 | #298 | Tragic 13.4% |
| Immigrants from Dominican Republic | 0.0 /100 | #299 | Tragic 13.4% |
Yakama Female Disability Correlation Summary
| Measurement | Yakama Data | Female Disability Data |
| Minimum | 0.033% | 2.3% |
| Maximum | 56.5% | 22.2% |
| Range | 56.5% | 19.9% |
| Mean | 8.9% | 14.3% |
| Median | 3.4% | 13.6% |
| Interquartile 25% (IQ1) | 1.6% | 12.0% |
| Interquartile 75% (IQ3) | 8.3% | 16.7% |
| Interquartile Range (IQR) | 6.6% | 4.7% |
| Standard Deviation (Sample) | 14.8% | 4.1% |
| Standard Deviation (Population) | 14.5% | 4.0% |
Correlation Details
| Yakama Percentile | Sample Size | Female Disability |
[ 0.0% - 0.5% ] 0.033% | 19,058,180 | 12.8% |
[ 0.0% - 0.5% ] 0.38% | 567,932 | 13.6% |
[ 0.5% - 1.0% ] 0.66% | 83,410 | 13.5% |
[ 0.5% - 1.0% ] 1.00% | 71,755 | 14.3% |
[ 1.0% - 1.5% ] 1.23% | 12,799 | 18.1% |
[ 1.0% - 1.5% ] 1.49% | 6,858 | 16.9% |
[ 1.5% - 2.0% ] 1.79% | 14,006 | 13.4% |
[ 2.0% - 2.5% ] 2.12% | 44,079 | 13.5% |
[ 2.0% - 2.5% ] 2.42% | 6,405 | 18.7% |
[ 2.5% - 3.0% ] 2.71% | 1,768 | 11.1% |
[ 3.0% - 3.5% ] 3.03% | 659 | 21.8% |
[ 3.0% - 3.5% ] 3.15% | 2,920 | 22.2% |
[ 3.0% - 3.5% ] 3.43% | 1,078 | 12.2% |
[ 4.0% - 4.5% ] 4.39% | 569 | 14.3% |
[ 4.5% - 5.0% ] 4.60% | 3,153 | 10.4% |
[ 5.5% - 6.0% ] 5.58% | 11,112 | 10.2% |
[ 7.0% - 7.5% ] 7.32% | 205 | 15.4% |
[ 7.5% - 8.0% ] 7.54% | 199 | 16.5% |
[ 7.5% - 8.0% ] 7.88% | 13,015 | 14.4% |
[ 8.5% - 9.0% ] 8.64% | 220 | 2.3% |
[ 11.0% - 11.5% ] 11.38% | 1,195 | 13.6% |
[ 11.5% - 12.0% ] 11.87% | 640 | 11.7% |
[ 17.5% - 18.0% ] 17.73% | 13,145 | 11.0% |
[ 55.0% - 55.5% ] 55.39% | 1,724 | 15.9% |
[ 56.5% - 57.0% ] 56.51% | 561 | 18.8% |