Yakama Receiving Food Stamps

COMPARE

Yakama
Race
Ancestry
AfghanAfricanAlaska NativeAlaskan AthabascanAlbanianAleutAlsatianAmericanApacheArabArapahoArgentineanArmenianAssyrian/Chaldean/SyriacAustralianAustrianBahamianBangladeshiBarbadianBasqueBelgianBelizeanBermudanBhutaneseBlackfeetBolivianBrazilianBritishBritish West IndianBulgarianBurmeseCajunCambodianCanadianCape VerdeanCarpatho RusynCelticCentral AmericanCentral American IndianCherokeeCheyenneChickasawChileanChineseChippewaChoctawColombianColvilleComancheCosta RicanCreeCreekCroatianCrowCubanCypriotCzechCzechoslovakianDanishDelawareDominicanDutchDutch West IndianEastern EuropeanEcuadorianEgyptianEnglishEstonianEthiopianEuropeanFijianFilipinoFinnishFrenchFrench American IndianFrench CanadianGermanGerman RussianGhanaianGreekGuamanian/ChamorroGuatemalanGuyaneseHaitianHmongHonduranHopiHoumaHungarianIcelanderIndian (Asian)IndonesianInupiatIranianIraqiIrishIroquoisIsraeliItalianJamaicanJapaneseJordanianKenyanKiowaKoreanLaotianLatvianLebaneseLiberianLithuanianLumbeeLuxembourgerMacedonianMalaysianMalteseMarshalleseMenomineeMexicanMexican American IndianMongolianMoroccanNative HawaiianNavajoNepaleseNew ZealanderNicaraguanNigerianNorthern EuropeanNorwegianOkinawanOsageOttawaPaiutePakistaniPalestinianPanamanianParaguayanPennsylvania GermanPeruvianPimaPolishPortuguesePotawatomiPuebloPuerto RicanPuget Sound SalishRomanianRussianSalvadoranSamoanScandinavianScotch-IrishScottishSeminoleSenegaleseSerbianShoshoneSierra LeoneanSiouxSlavicSlovakSloveneSomaliSouth AfricanSouth AmericanSouth American IndianSoviet UnionSpaniardSpanishSpanish AmericanSpanish American IndianSri LankanSubsaharan AfricanSudaneseSwedishSwissSyrianTaiwaneseThaiTlingit-HaidaTohono O'OdhamTonganTrinidadian and TobagonianTsimshianTurkishU.S. Virgin IslanderUgandanUkrainianUruguayanUteVenezuelanVietnameseWelshWest IndianYakamaYaquiYugoslavianYumanYup'ikZimbabwean
Immigration
NonimmigrantsImmigrantsAfghanistanAfricaAlbaniaArgentinaArmeniaAsiaAustraliaAustriaBahamasBangladeshBarbadosBelarusBelgiumBelizeBoliviaBosnia and HerzegovinaBrazilBulgariaBurma/MyanmarCabo VerdeCambodiaCameroonCanadaCaribbeanCentral AmericaChileChinaColombiaCongoCosta RicaCroatiaCubaCzechoslovakiaDenmarkDominicaDominican RepublicEastern AfricaEastern AsiaEastern EuropeEcuadorEgyptEl SalvadorEnglandEritreaEthiopiaEuropeFijiFranceGermanyGhanaGreeceGrenadaGuatemalaGuyanaHaitiHondurasHong KongHungaryIndiaIndonesiaIranIraqIrelandIsraelItalyJamaicaJapanJordanKazakhstanKenyaKoreaKuwaitLaosLatin AmericaLatviaLebanonLiberiaLithuaniaMalaysiaMexicoMicronesiaMiddle AfricaMoldovaMoroccoNepalNetherlandsNicaraguaNigeriaNorth AmericaNorth MacedoniaNorthern AfricaNorthern EuropeNorwayOceaniaPakistanPanamaPeruPhilippinesPolandPortugalRomaniaRussiaSaudi ArabiaScotlandSenegalSerbiaSierra LeoneSingaporeSomaliaSouth AfricaSouth AmericaSouth Central AsiaSouth Eastern AsiaSouthern EuropeSpainSri LankaSt. Vincent and the GrenadinesSudanSwedenSwitzerlandSyriaTaiwanThailandTrinidad and TobagoTurkeyUgandaUkraineUruguayUzbekistanVenezuelaVietnamWest IndiesWestern AfricaWestern AsiaWestern EuropeYemenZaireZimbabweAzores
Select to Compare
Race
Ancestry
AfghanAfricanAlaska NativeAlaskan AthabascanAlbanianAleutAlsatianAmericanApacheArabArapahoArgentineanArmenianAssyrian/Chaldean/SyriacAustralianAustrianBahamianBangladeshiBarbadianBasqueBelgianBelizeanBermudanBhutaneseBlackfeetBolivianBrazilianBritishBritish West IndianBulgarianBurmeseCajunCambodianCanadianCape VerdeanCarpatho RusynCelticCentral AmericanCentral American IndianCherokeeCheyenneChickasawChileanChineseChippewaChoctawColombianColvilleComancheCosta RicanCreeCreekCroatianCrowCubanCypriotCzechCzechoslovakianDanishDelawareDominicanDutchDutch West IndianEastern EuropeanEcuadorianEgyptianEnglishEstonianEthiopianEuropeanFijianFilipinoFinnishFrenchFrench American IndianFrench CanadianGermanGerman RussianGhanaianGreekGuamanian/ChamorroGuatemalanGuyaneseHaitianHmongHonduranHopiHoumaHungarianIcelanderIndian (Asian)IndonesianInupiatIranianIraqiIrishIroquoisIsraeliItalianJamaicanJapaneseJordanianKenyanKiowaKoreanLaotianLatvianLebaneseLiberianLithuanianLumbeeLuxembourgerMacedonianMalaysianMalteseMarshalleseMenomineeMexicanMexican American IndianMongolianMoroccanNative HawaiianNavajoNepaleseNew ZealanderNicaraguanNigerianNorthern EuropeanNorwegianOkinawanOsageOttawaPaiutePakistaniPalestinianPanamanianParaguayanPennsylvania GermanPeruvianPimaPolishPortuguesePotawatomiPuebloPuerto RicanPuget Sound SalishRomanianRussianSalvadoranSamoanScandinavianScotch-IrishScottishSeminoleSenegaleseSerbianShoshoneSierra LeoneanSiouxSlavicSlovakSloveneSomaliSouth AfricanSouth AmericanSouth American IndianSoviet UnionSpaniardSpanishSpanish AmericanSpanish American IndianSri LankanSubsaharan AfricanSudaneseSwedishSwissSyrianTaiwaneseThaiTlingit-HaidaTohono O'OdhamTonganTrinidadian and TobagonianTsimshianTurkishU.S. Virgin IslanderUgandanUkrainianUruguayanUteVenezuelanVietnameseWelshWest IndianYaquiYugoslavianYumanYup'ikZimbabwean
Immigration
NonimmigrantsImmigrantsAfghanistanAfricaAlbaniaArgentinaArmeniaAsiaAustraliaAustriaBahamasBangladeshBarbadosBelarusBelgiumBelizeBoliviaBosnia and HerzegovinaBrazilBulgariaBurma/MyanmarCabo VerdeCambodiaCameroonCanadaCaribbeanCentral AmericaChileChinaColombiaCongoCosta RicaCroatiaCubaCzechoslovakiaDenmarkDominicaDominican RepublicEastern AfricaEastern AsiaEastern EuropeEcuadorEgyptEl SalvadorEnglandEritreaEthiopiaEuropeFijiFranceGermanyGhanaGreeceGrenadaGuatemalaGuyanaHaitiHondurasHong KongHungaryIndiaIndonesiaIranIraqIrelandIsraelItalyJamaicaJapanJordanKazakhstanKenyaKoreaKuwaitLaosLatin AmericaLatviaLebanonLiberiaLithuaniaMalaysiaMexicoMicronesiaMiddle AfricaMoldovaMoroccoNepalNetherlandsNicaraguaNigeriaNorth AmericaNorth MacedoniaNorthern AfricaNorthern EuropeNorwayOceaniaPakistanPanamaPeruPhilippinesPolandPortugalRomaniaRussiaSaudi ArabiaScotlandSenegalSerbiaSierra LeoneSingaporeSomaliaSouth AfricaSouth AmericaSouth Central AsiaSouth Eastern AsiaSouthern EuropeSpainSri LankaSt. Vincent and the GrenadinesSudanSwedenSwitzerlandSyriaTaiwanThailandTrinidad and TobagoTurkeyUgandaUkraineUruguayUzbekistanVenezuelaVietnamWest IndiesWestern AfricaWestern AsiaWestern EuropeYemenZaireZimbabweAzores
Receiving Food Stamps
Income
Poverty
Unemployment
Labor Participation
Family Structure
Vehicle Availability
Education Level
Disability

Yakama Receiving Food Stamps
Tragic

21.4%
PUBLIC INCOME | FOOD STAMPS
0.0/ 100
METRIC RATING
339th/ 347
METRIC RANK

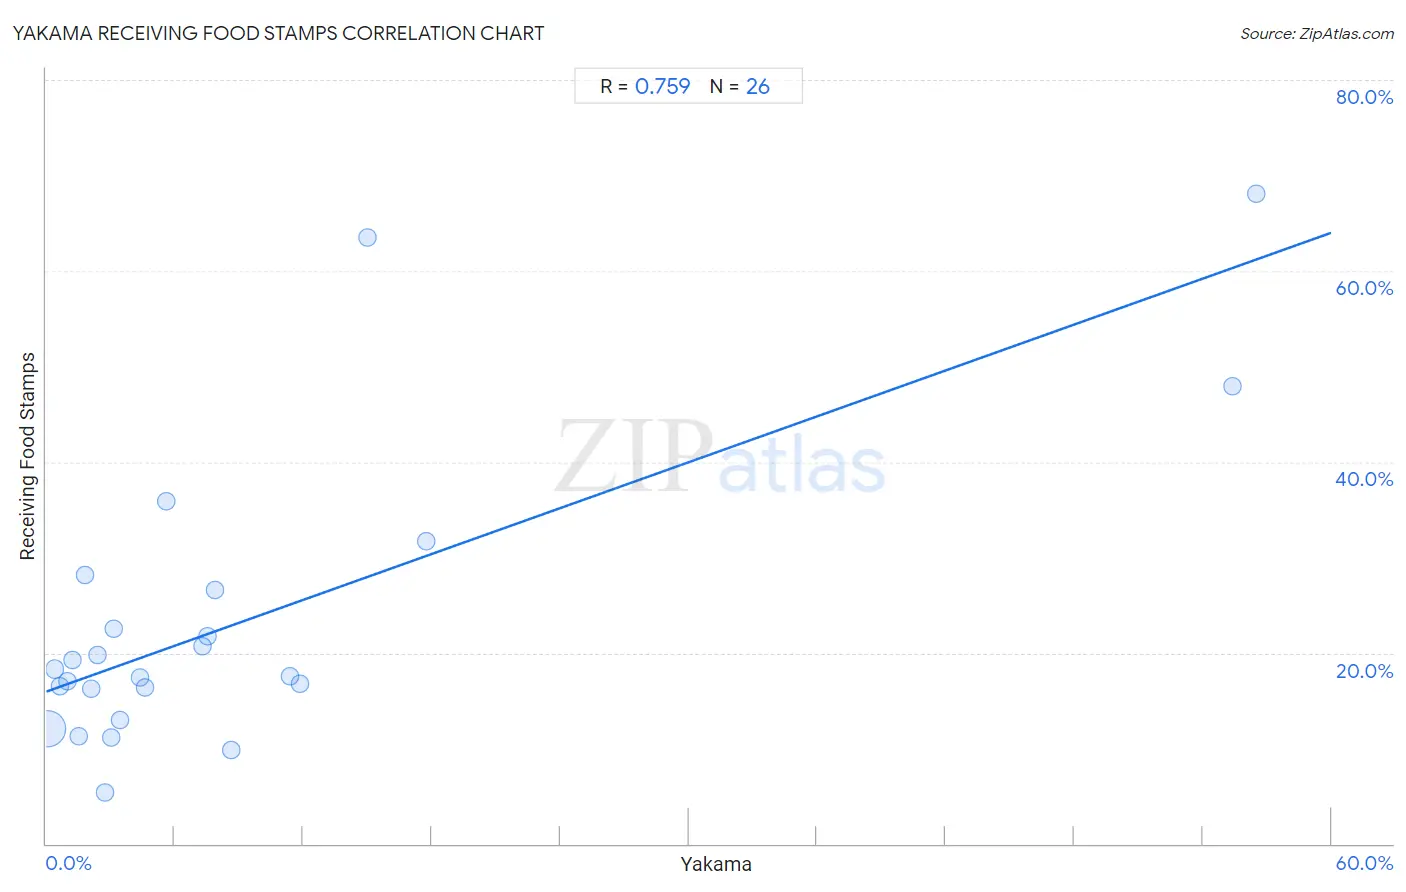
Yakama Receiving Food Stamps Correlation Chart

The statistical analysis conducted on geographies consisting of 19,916,824 people shows a strong positive correlation between the proportion of Yakama and percentage of population receiving government assistance and/or food stamps in the United States with a correlation coefficient (R) of 0.759 and weighted average of 21.4%. On average, for every 1% (one percent) increase in Yakama within a typical geography, there is an increase of 0.80% in percentage of population receiving government assistance and/or food stamps.
Yakama Receiving Food Stamps
It is essential to understand that the correlation between the percentage of Yakama and percentage of population receiving government assistance and/or food stamps does not imply a direct cause-and-effect relationship. It remains uncertain whether the presence of Yakama influences an upward or downward trend in the level of percentage of population receiving government assistance and/or food stamps within an area, or if Yakama simply ended up residing in those areas with higher or lower levels of percentage of population receiving government assistance and/or food stamps due to other factors.

Demographics Similar to Yakama by Receiving Food Stamps

In terms of receiving food stamps, the demographic groups most similar to Yakama are Dominican (21.4%, a difference of 0.26%), Tohono O'odham (21.5%, a difference of 0.26%), Hopi (21.6%, a difference of 0.63%), Immigrants from Yemen (21.6%, a difference of 1.0%), and Cape Verdean (21.1%, a difference of 1.7%).
DemographicsRating | RankReceiving Food Stamps
Pueblo
0.0
/100
|
#332
Tragic
19.9%
Inupiat
0.0
/100
|
#333
Tragic
20.1%
Yuman
0.0
/100
|
#334
Tragic
20.2%
Immigrants from Cuba
0.0
/100
|
#335
Tragic
20.8%
Navajo
0.0
/100
|
#336
Tragic
21.1%
Cape Verdeans
0.0
/100
|
#337
Tragic
21.1%
Dominicans
0.0
/100
|
#338
Tragic
21.4%
Yakama
0.0
/100
|
#339
Tragic
21.4%
Tohono O'odham
0.0
/100
|
#340
Tragic
21.5%
Hopi
0.0
/100
|
#341
Tragic
21.6%
Immigrants from Yemen
0.0
/100
|
#342
Tragic
21.6%
Immigrants from Dominican Republic
0.0
/100
|
#343
Tragic
22.1%
Lumbee
0.0
/100
|
#344
Tragic
22.9%
Immigrants from Cabo Verde
0.0
/100
|
#345
Tragic
23.8%
Puerto Ricans
0.0
/100
|
#346
Tragic
26.0%

Yakama Receiving Food Stamps Correlation Summary

MeasurementYakama DataReceiving Food Stamps Data
Minimum0.033%5.4%
Maximum56.5%68.1%
Range56.5%62.7%
Mean9.1%23.3%
Median3.9%17.9%
Interquartile 25% (IQ1)1.8%16.3%
Interquartile 75% (IQ3)8.6%26.6%
Interquartile Range (IQR)6.8%10.3%
Standard Deviation (Sample)14.5%15.3%
Standard Deviation (Population)14.3%15.0%

Correlation Details

Yakama PercentileSample SizeReceiving Food Stamps
[
0.0%
-
0.5%
]
0.033%
19,058,18012.1%
[
0.0%
-
0.5%
]
0.38%
567,93218.3%
[
0.5%
-
1.0%
]
0.66%
83,41016.5%
[
0.5%
-
1.0%
]
1.00%
71,75517.0%
[
1.0%
-
1.5%
]
1.23%
12,79919.3%
[
1.0%
-
1.5%
]
1.49%
5,97511.3%
[
1.5%
-
2.0%
]
1.79%
14,00628.1%
[
2.0%
-
2.5%
]
2.12%
44,07916.3%
[
2.0%
-
2.5%
]
2.42%
6,40519.8%
[
2.5%
-
3.0%
]
2.71%
1,7685.4%
[
3.0%
-
3.5%
]
3.03%
65911.1%
[
3.0%
-
3.5%
]
3.15%
2,92022.6%
[
3.0%
-
3.5%
]
3.43%
1,07813.0%
[
4.0%
-
4.5%
]
4.39%
56917.4%
[
4.5%
-
5.0%
]
4.60%
3,15316.4%
[
5.5%
-
6.0%
]
5.58%
11,11235.8%
[
7.0%
-
7.5%
]
7.32%
20520.7%
[
7.5%
-
8.0%
]
7.54%
19921.8%
[
7.5%
-
8.0%
]
7.88%
13,01526.6%
[
8.5%
-
9.0%
]
8.64%
2209.8%
[
11.0%
-
11.5%
]
11.38%
1,19517.5%
[
11.5%
-
12.0%
]
11.87%
64016.7%
[
15.0%
-
15.5%
]
15.00%
12063.5%
[
17.5%
-
18.0%
]
17.73%
13,14531.7%
[
55.0%
-
55.5%
]
55.39%
1,72447.9%
[
56.5%
-
57.0%
]
56.51%
56168.1%