Yakama Married-couple Households

COMPARE

Yakama
Race
Ancestry
AfghanAfricanAlaska NativeAlaskan AthabascanAlbanianAleutAlsatianAmericanApacheArabArapahoArgentineanArmenianAssyrian/Chaldean/SyriacAustralianAustrianBahamianBangladeshiBarbadianBasqueBelgianBelizeanBermudanBhutaneseBlackfeetBolivianBrazilianBritishBritish West IndianBulgarianBurmeseCajunCambodianCanadianCape VerdeanCarpatho RusynCelticCentral AmericanCentral American IndianCherokeeCheyenneChickasawChileanChineseChippewaChoctawColombianColvilleComancheCosta RicanCreeCreekCroatianCrowCubanCypriotCzechCzechoslovakianDanishDelawareDominicanDutchDutch West IndianEastern EuropeanEcuadorianEgyptianEnglishEstonianEthiopianEuropeanFijianFilipinoFinnishFrenchFrench American IndianFrench CanadianGermanGerman RussianGhanaianGreekGuamanian/ChamorroGuatemalanGuyaneseHaitianHmongHonduranHopiHoumaHungarianIcelanderIndian (Asian)IndonesianInupiatIranianIraqiIrishIroquoisIsraeliItalianJamaicanJapaneseJordanianKenyanKiowaKoreanLaotianLatvianLebaneseLiberianLithuanianLumbeeLuxembourgerMacedonianMalaysianMalteseMarshalleseMenomineeMexicanMexican American IndianMongolianMoroccanNative HawaiianNavajoNepaleseNew ZealanderNicaraguanNigerianNorthern EuropeanNorwegianOkinawanOsageOttawaPaiutePakistaniPalestinianPanamanianParaguayanPennsylvania GermanPeruvianPimaPolishPortuguesePotawatomiPuebloPuerto RicanPuget Sound SalishRomanianRussianSalvadoranSamoanScandinavianScotch-IrishScottishSeminoleSenegaleseSerbianShoshoneSierra LeoneanSiouxSlavicSlovakSloveneSomaliSouth AfricanSouth AmericanSouth American IndianSoviet UnionSpaniardSpanishSpanish AmericanSpanish American IndianSri LankanSubsaharan AfricanSudaneseSwedishSwissSyrianTaiwaneseThaiTlingit-HaidaTohono O'OdhamTonganTrinidadian and TobagonianTsimshianTurkishU.S. Virgin IslanderUgandanUkrainianUruguayanUteVenezuelanVietnameseWelshWest IndianYakamaYaquiYugoslavianYumanYup'ikZimbabwean
Immigration
NonimmigrantsImmigrantsAfghanistanAfricaAlbaniaArgentinaArmeniaAsiaAustraliaAustriaBahamasBangladeshBarbadosBelarusBelgiumBelizeBoliviaBosnia and HerzegovinaBrazilBulgariaBurma/MyanmarCabo VerdeCambodiaCameroonCanadaCaribbeanCentral AmericaChileChinaColombiaCongoCosta RicaCroatiaCubaCzechoslovakiaDenmarkDominicaDominican RepublicEastern AfricaEastern AsiaEastern EuropeEcuadorEgyptEl SalvadorEnglandEritreaEthiopiaEuropeFijiFranceGermanyGhanaGreeceGrenadaGuatemalaGuyanaHaitiHondurasHong KongHungaryIndiaIndonesiaIranIraqIrelandIsraelItalyJamaicaJapanJordanKazakhstanKenyaKoreaKuwaitLaosLatin AmericaLatviaLebanonLiberiaLithuaniaMalaysiaMexicoMicronesiaMiddle AfricaMoldovaMoroccoNepalNetherlandsNicaraguaNigeriaNorth AmericaNorth MacedoniaNorthern AfricaNorthern EuropeNorwayOceaniaPakistanPanamaPeruPhilippinesPolandPortugalRomaniaRussiaSaudi ArabiaScotlandSenegalSerbiaSierra LeoneSingaporeSomaliaSouth AfricaSouth AmericaSouth Central AsiaSouth Eastern AsiaSouthern EuropeSpainSri LankaSt. Vincent and the GrenadinesSudanSwedenSwitzerlandSyriaTaiwanThailandTrinidad and TobagoTurkeyUgandaUkraineUruguayUzbekistanVenezuelaVietnamWest IndiesWestern AfricaWestern AsiaWestern EuropeYemenZaireZimbabweAzores
Select to Compare
Race
Ancestry
AfghanAfricanAlaska NativeAlaskan AthabascanAlbanianAleutAlsatianAmericanApacheArabArapahoArgentineanArmenianAssyrian/Chaldean/SyriacAustralianAustrianBahamianBangladeshiBarbadianBasqueBelgianBelizeanBermudanBhutaneseBlackfeetBolivianBrazilianBritishBritish West IndianBulgarianBurmeseCajunCambodianCanadianCape VerdeanCarpatho RusynCelticCentral AmericanCentral American IndianCherokeeCheyenneChickasawChileanChineseChippewaChoctawColombianColvilleComancheCosta RicanCreeCreekCroatianCrowCubanCypriotCzechCzechoslovakianDanishDelawareDominicanDutchDutch West IndianEastern EuropeanEcuadorianEgyptianEnglishEstonianEthiopianEuropeanFijianFilipinoFinnishFrenchFrench American IndianFrench CanadianGermanGerman RussianGhanaianGreekGuamanian/ChamorroGuatemalanGuyaneseHaitianHmongHonduranHopiHoumaHungarianIcelanderIndian (Asian)IndonesianInupiatIranianIraqiIrishIroquoisIsraeliItalianJamaicanJapaneseJordanianKenyanKiowaKoreanLaotianLatvianLebaneseLiberianLithuanianLumbeeLuxembourgerMacedonianMalaysianMalteseMarshalleseMenomineeMexicanMexican American IndianMongolianMoroccanNative HawaiianNavajoNepaleseNew ZealanderNicaraguanNigerianNorthern EuropeanNorwegianOkinawanOsageOttawaPaiutePakistaniPalestinianPanamanianParaguayanPennsylvania GermanPeruvianPimaPolishPortuguesePotawatomiPuebloPuerto RicanPuget Sound SalishRomanianRussianSalvadoranSamoanScandinavianScotch-IrishScottishSeminoleSenegaleseSerbianShoshoneSierra LeoneanSiouxSlavicSlovakSloveneSomaliSouth AfricanSouth AmericanSouth American IndianSoviet UnionSpaniardSpanishSpanish AmericanSpanish American IndianSri LankanSubsaharan AfricanSudaneseSwedishSwissSyrianTaiwaneseThaiTlingit-HaidaTohono O'OdhamTonganTrinidadian and TobagonianTsimshianTurkishU.S. Virgin IslanderUgandanUkrainianUruguayanUteVenezuelanVietnameseWelshWest IndianYaquiYugoslavianYumanYup'ikZimbabwean
Immigration
NonimmigrantsImmigrantsAfghanistanAfricaAlbaniaArgentinaArmeniaAsiaAustraliaAustriaBahamasBangladeshBarbadosBelarusBelgiumBelizeBoliviaBosnia and HerzegovinaBrazilBulgariaBurma/MyanmarCabo VerdeCambodiaCameroonCanadaCaribbeanCentral AmericaChileChinaColombiaCongoCosta RicaCroatiaCubaCzechoslovakiaDenmarkDominicaDominican RepublicEastern AfricaEastern AsiaEastern EuropeEcuadorEgyptEl SalvadorEnglandEritreaEthiopiaEuropeFijiFranceGermanyGhanaGreeceGrenadaGuatemalaGuyanaHaitiHondurasHong KongHungaryIndiaIndonesiaIranIraqIrelandIsraelItalyJamaicaJapanJordanKazakhstanKenyaKoreaKuwaitLaosLatin AmericaLatviaLebanonLiberiaLithuaniaMalaysiaMexicoMicronesiaMiddle AfricaMoldovaMoroccoNepalNetherlandsNicaraguaNigeriaNorth AmericaNorth MacedoniaNorthern AfricaNorthern EuropeNorwayOceaniaPakistanPanamaPeruPhilippinesPolandPortugalRomaniaRussiaSaudi ArabiaScotlandSenegalSerbiaSierra LeoneSingaporeSomaliaSouth AfricaSouth AmericaSouth Central AsiaSouth Eastern AsiaSouthern EuropeSpainSri LankaSt. Vincent and the GrenadinesSudanSwedenSwitzerlandSyriaTaiwanThailandTrinidad and TobagoTurkeyUgandaUkraineUruguayUzbekistanVenezuelaVietnamWest IndiesWestern AfricaWestern AsiaWestern EuropeYemenZaireZimbabweAzores
Married-couple Households
Income
Poverty
Unemployment
Labor Participation
Family Structure
Vehicle Availability
Education Level
Disability

Yakama Married-couple Households
Tragic

45.2%
MARRIED-COUPLE HOUSEHOLDS
5.8/ 100
METRIC RATING
213th/ 347
METRIC RANK

Yakama Married-couple Households Correlation Chart

The statistical analysis conducted on geographies consisting of 19,917,879 people shows a substantial negative correlation between the proportion of Yakama and percentage of married-couple family households in the United States with a correlation coefficient (R) of -0.505 and weighted average of 45.2%. On average, for every 1% (one percent) increase in Yakama within a typical geography, there is a decrease of 0.38% in percentage of married-couple family households.
Yakama Married-couple Households
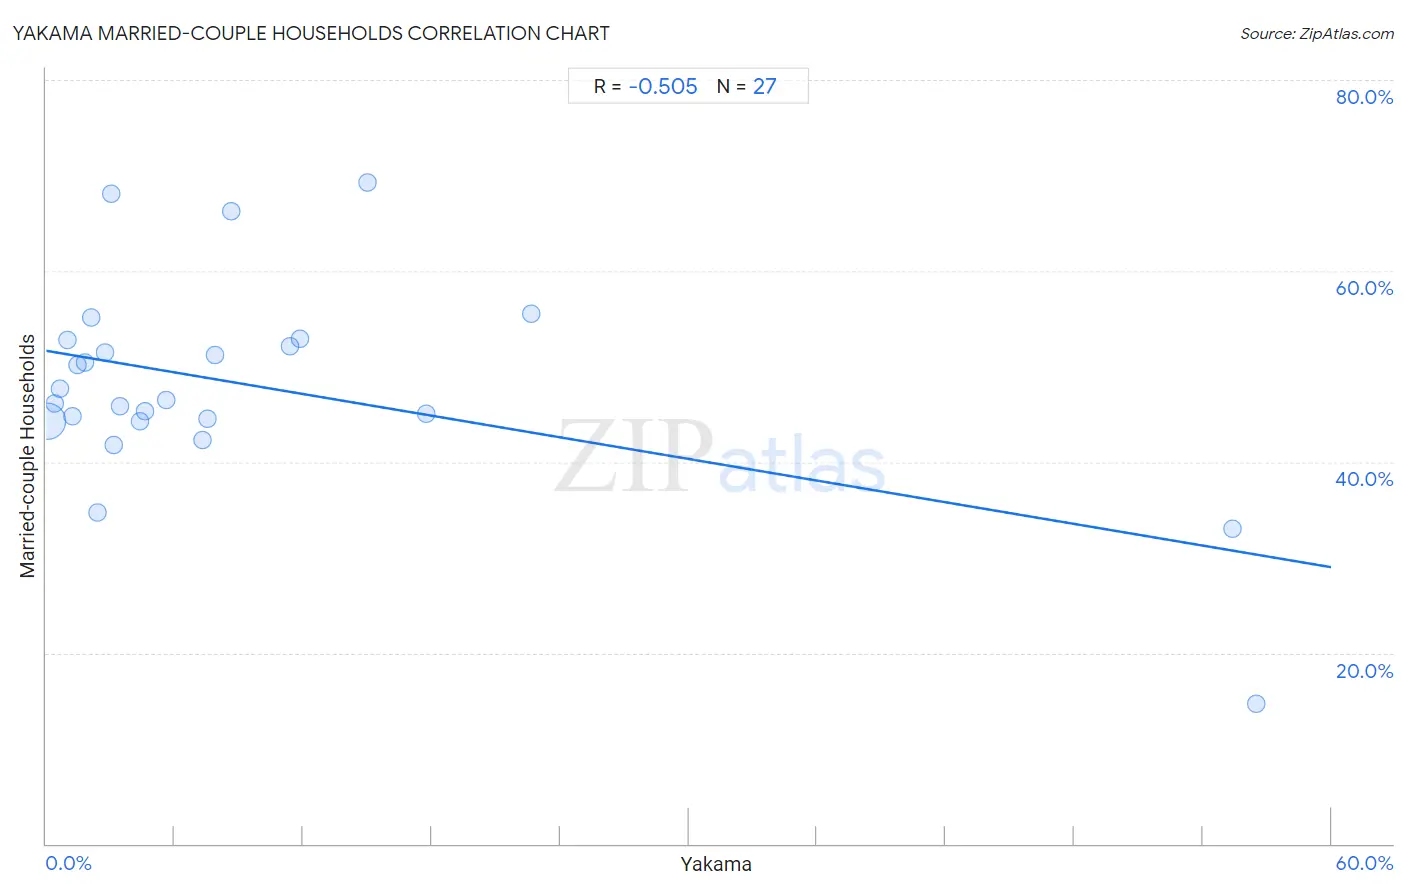
It is essential to understand that the correlation between the percentage of Yakama and percentage of married-couple family households does not imply a direct cause-and-effect relationship. It remains uncertain whether the presence of Yakama influences an upward or downward trend in the level of percentage of married-couple family households within an area, or if Yakama simply ended up residing in those areas with higher or lower levels of percentage of married-couple family households due to other factors.

Demographics Similar to Yakama by Married-couple Households

In terms of married-couple households, the demographic groups most similar to Yakama are Japanese (45.2%, a difference of 0.020%), Immigrants from Nepal (45.2%, a difference of 0.040%), Immigrants from Portugal (45.2%, a difference of 0.050%), Panamanian (45.2%, a difference of 0.070%), and Immigrants from the Azores (45.2%, a difference of 0.090%).
DemographicsRating | RankMarried-couple Households
Uruguayans
10.4
/100
|
#206
Poor
45.5%
Immigrants from France
8.8
/100
|
#207
Tragic
45.4%
Hispanics or Latinos
8.7
/100
|
#208
Tragic
45.4%
Immigrants from Uzbekistan
8.4
/100
|
#209
Tragic
45.4%
Cubans
7.7
/100
|
#210
Tragic
45.4%
Immigrants from Spain
7.3
/100
|
#211
Tragic
45.3%
Creek
6.4
/100
|
#212
Tragic
45.3%
Yakama
5.8
/100
|
#213
Tragic
45.2%
Japanese
5.7
/100
|
#214
Tragic
45.2%
Immigrants from Nepal
5.6
/100
|
#215
Tragic
45.2%
Immigrants from Portugal
5.6
/100
|
#216
Tragic
45.2%
Panamanians
5.5
/100
|
#217
Tragic
45.2%
Immigrants from the Azores
5.3
/100
|
#218
Tragic
45.2%
Nicaraguans
5.3
/100
|
#219
Tragic
45.2%
Immigrants from Thailand
5.1
/100
|
#220
Tragic
45.2%

Yakama Married-couple Households Correlation Summary

MeasurementYakama DataMarried-couple Households Data
Minimum0.033%14.7%
Maximum56.5%69.2%
Range56.5%54.6%
Mean9.6%48.0%
Median4.4%46.5%
Interquartile 25% (IQ1)1.8%44.3%
Interquartile 75% (IQ3)11.4%52.8%
Interquartile Range (IQR)9.6%8.5%
Standard Deviation (Sample)14.5%10.8%
Standard Deviation (Population)14.2%10.6%

Correlation Details

Yakama PercentileSample SizeMarried-couple Households
[
0.0%
-
0.5%
]
0.033%
19,058,18044.2%
[
0.0%
-
0.5%
]
0.38%
567,93246.1%
[
0.5%
-
1.0%
]
0.66%
83,41047.6%
[
0.5%
-
1.0%
]
1.00%
71,75552.8%
[
1.0%
-
1.5%
]
1.23%
12,79944.8%
[
1.0%
-
1.5%
]
1.49%
6,85850.1%
[
1.5%
-
2.0%
]
1.79%
14,00650.4%
[
2.0%
-
2.5%
]
2.12%
44,07955.1%
[
2.0%
-
2.5%
]
2.42%
6,40534.7%
[
2.5%
-
3.0%
]
2.71%
1,76851.5%
[
3.0%
-
3.5%
]
3.03%
65968.1%
[
3.0%
-
3.5%
]
3.15%
2,92041.8%
[
3.0%
-
3.5%
]
3.43%
1,07845.8%
[
4.0%
-
4.5%
]
4.39%
56944.3%
[
4.5%
-
5.0%
]
4.60%
3,15345.3%
[
5.5%
-
6.0%
]
5.58%
11,11246.5%
[
7.0%
-
7.5%
]
7.32%
20542.2%
[
7.5%
-
8.0%
]
7.54%
19944.5%
[
7.5%
-
8.0%
]
7.88%
13,01551.2%
[
8.5%
-
9.0%
]
8.64%
22066.3%
[
11.0%
-
11.5%
]
11.38%
1,19552.2%
[
11.5%
-
12.0%
]
11.87%
64052.9%
[
15.0%
-
15.5%
]
15.00%
12069.2%
[
17.5%
-
18.0%
]
17.73%
13,14545.1%
[
22.5%
-
23.0%
]
22.67%
17255.6%
[
55.0%
-
55.5%
]
55.39%
1,72433.0%
[
56.5%
-
57.0%
]
56.51%
56114.7%