Slovak 2 or more Vehicles in Household
COMPARE
Slovak
Select to Compare
2 or more Vehicles in Household
Slovak 2 or more Vehicles in Household
58.0%
2+ VEHICLES AVAILABLE
99.2/ 100
METRIC RATING
85th/ 347
METRIC RANK
Slovak 2 or more Vehicles in Household Correlation Chart
The statistical analysis conducted on geographies consisting of 397,714,521 people shows a mild positive correlation between the proportion of Slovaks and percentage of households with 2 or more vehicles available in the United States with a correlation coefficient (R) of 0.321 and weighted average of 58.0%. On average, for every 1% (one percent) increase in Slovaks within a typical geography, there is an increase of 0.36% in percentage of households with 2 or more vehicles available.
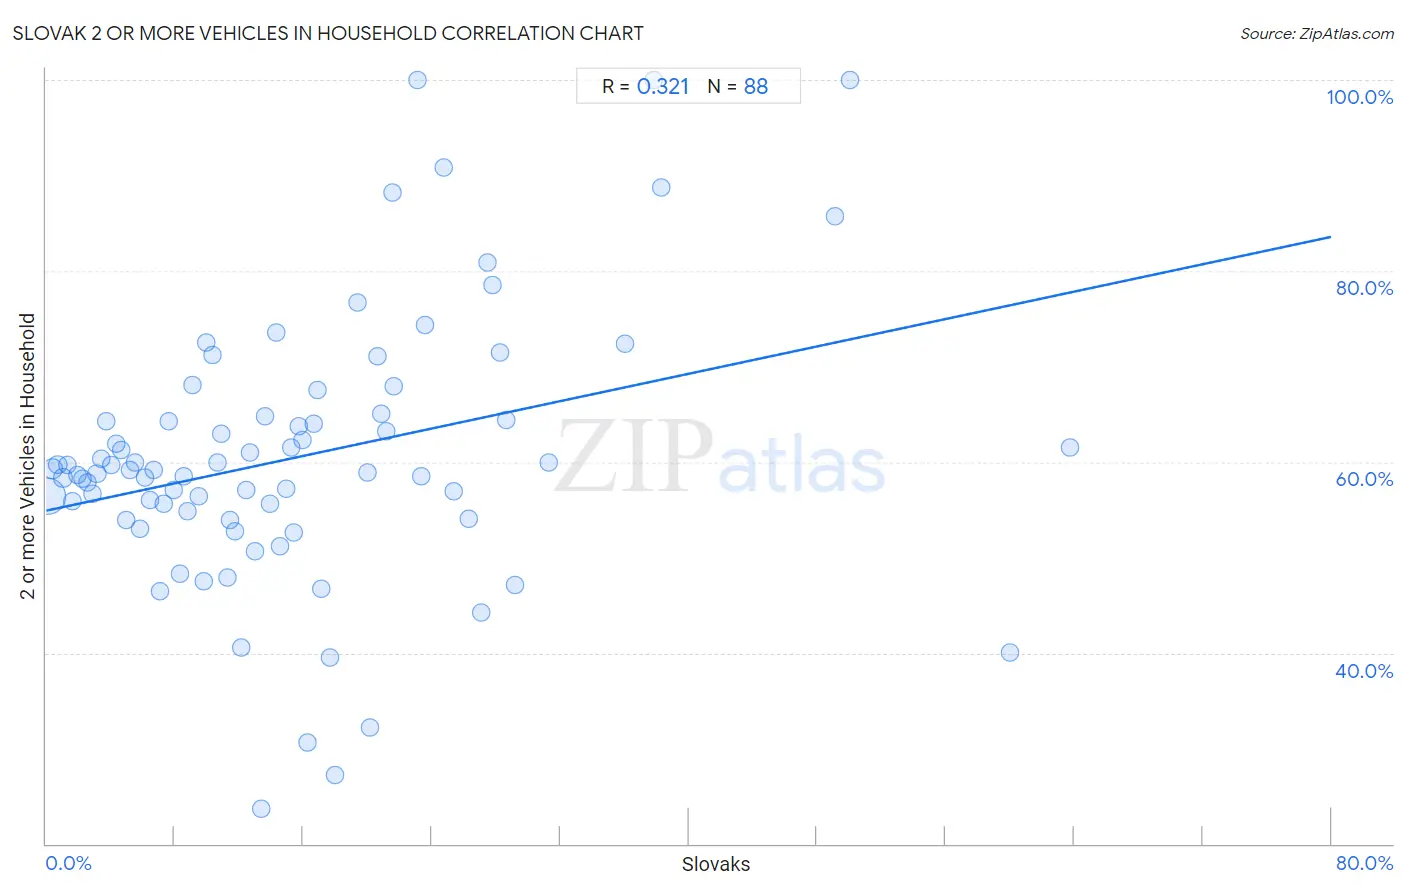
It is essential to understand that the correlation between the percentage of Slovaks and percentage of households with 2 or more vehicles available does not imply a direct cause-and-effect relationship. It remains uncertain whether the presence of Slovaks influences an upward or downward trend in the level of percentage of households with 2 or more vehicles available within an area, or if Slovaks simply ended up residing in those areas with higher or lower levels of percentage of households with 2 or more vehicles available due to other factors.
Demographics Similar to Slovaks by 2 or more Vehicles in Household
In terms of 2 or more vehicles in household, the demographic groups most similar to Slovaks are Potawatomi (58.0%, a difference of 0.030%), Maltese (58.0%, a difference of 0.050%), Thai (57.9%, a difference of 0.070%), Icelander (58.0%, a difference of 0.080%), and Immigrants from Iran (57.9%, a difference of 0.080%).
| Demographics | Rating | Rank | 2 or more Vehicles in Household |
| Lithuanians | 99.5 /100 | #78 | Exceptional 58.2% |
| Delaware | 99.4 /100 | #79 | Exceptional 58.2% |
| Immigrants from England | 99.3 /100 | #80 | Exceptional 58.1% |
| Immigrants from Iraq | 99.3 /100 | #81 | Exceptional 58.1% |
| Iranians | 99.3 /100 | #82 | Exceptional 58.1% |
| Icelanders | 99.2 /100 | #83 | Exceptional 58.0% |
| Maltese | 99.2 /100 | #84 | Exceptional 58.0% |
| Slovaks | 99.2 /100 | #85 | Exceptional 58.0% |
| Potawatomi | 99.1 /100 | #86 | Exceptional 58.0% |
| Thais | 99.1 /100 | #87 | Exceptional 57.9% |
| Immigrants from Iran | 99.1 /100 | #88 | Exceptional 57.9% |
| Immigrants from Germany | 99.0 /100 | #89 | Exceptional 57.9% |
| Hispanics or Latinos | 99.0 /100 | #90 | Exceptional 57.9% |
| Pakistanis | 99.0 /100 | #91 | Exceptional 57.9% |
| Shoshone | 99.0 /100 | #92 | Exceptional 57.9% |
Slovak 2 or more Vehicles in Household Correlation Summary
| Measurement | Slovak Data | 2 or more Vehicles in Household Data |
| Minimum | 0.10% | 23.6% |
| Maximum | 63.7% | 100.0% |
| Range | 63.6% | 76.4% |
| Mean | 15.7% | 60.5% |
| Median | 13.2% | 59.1% |
| Interquartile 25% (IQ1) | 6.6% | 54.5% |
| Interquartile 75% (IQ3) | 21.4% | 64.6% |
| Interquartile Range (IQR) | 14.8% | 10.1% |
| Standard Deviation (Sample) | 12.7% | 14.2% |
| Standard Deviation (Population) | 12.7% | 14.1% |
Correlation Details
| Slovak Percentile | Sample Size | 2 or more Vehicles in Household |
[ 0.0% - 0.5% ] 0.10% | 322,339,449 | 56.3% |
[ 0.0% - 0.5% ] 0.41% | 42,169,378 | 59.3% |
[ 0.5% - 1.0% ] 0.72% | 12,581,890 | 59.7% |
[ 1.0% - 1.5% ] 1.04% | 5,574,615 | 58.3% |
[ 1.0% - 1.5% ] 1.34% | 3,156,631 | 59.7% |
[ 1.5% - 2.0% ] 1.66% | 2,409,765 | 55.9% |
[ 1.5% - 2.0% ] 1.94% | 1,550,519 | 58.7% |
[ 2.0% - 2.5% ] 2.27% | 1,592,059 | 58.2% |
[ 2.5% - 3.0% ] 2.54% | 860,255 | 57.9% |
[ 2.5% - 3.0% ] 2.85% | 903,420 | 56.6% |
[ 3.0% - 3.5% ] 3.15% | 681,261 | 58.7% |
[ 3.0% - 3.5% ] 3.43% | 712,832 | 60.3% |
[ 3.5% - 4.0% ] 3.74% | 478,761 | 64.2% |
[ 4.0% - 4.5% ] 4.06% | 460,876 | 59.7% |
[ 4.0% - 4.5% ] 4.34% | 330,090 | 61.9% |
[ 4.5% - 5.0% ] 4.66% | 214,063 | 61.3% |
[ 4.5% - 5.0% ] 4.96% | 258,732 | 53.9% |
[ 5.0% - 5.5% ] 5.20% | 202,255 | 59.1% |
[ 5.5% - 6.0% ] 5.55% | 103,859 | 59.9% |
[ 5.5% - 6.0% ] 5.87% | 210,385 | 53.0% |
[ 6.0% - 6.5% ] 6.14% | 122,690 | 58.4% |
[ 6.0% - 6.5% ] 6.48% | 101,816 | 56.1% |
[ 6.5% - 7.0% ] 6.71% | 170,716 | 59.2% |
[ 7.0% - 7.5% ] 7.08% | 35,202 | 46.4% |
[ 7.0% - 7.5% ] 7.33% | 41,899 | 55.7% |
[ 7.5% - 8.0% ] 7.64% | 81,898 | 64.3% |
[ 7.5% - 8.0% ] 7.91% | 33,000 | 57.1% |
[ 8.0% - 8.5% ] 8.29% | 67,145 | 48.3% |
[ 8.5% - 9.0% ] 8.54% | 51,836 | 58.5% |
[ 8.5% - 9.0% ] 8.81% | 27,729 | 54.9% |
[ 9.0% - 9.5% ] 9.13% | 17,284 | 68.1% |
[ 9.0% - 9.5% ] 9.47% | 9,473 | 56.4% |
[ 9.5% - 10.0% ] 9.77% | 42,065 | 47.4% |
[ 9.5% - 10.0% ] 9.94% | 3,461 | 72.6% |
[ 10.0% - 10.5% ] 10.38% | 3,286 | 71.2% |
[ 10.5% - 11.0% ] 10.62% | 16,369 | 60.0% |
[ 10.5% - 11.0% ] 10.87% | 3,669 | 63.0% |
[ 11.0% - 11.5% ] 11.27% | 1,340 | 47.9% |
[ 11.0% - 11.5% ] 11.46% | 39,331 | 53.9% |
[ 11.5% - 12.0% ] 11.79% | 1,663 | 52.7% |
[ 12.0% - 12.5% ] 12.16% | 2,640 | 40.6% |
[ 12.0% - 12.5% ] 12.42% | 1,208 | 57.0% |
[ 12.5% - 13.0% ] 12.66% | 5,465 | 61.0% |
[ 12.5% - 13.0% ] 12.96% | 7,216 | 50.7% |
[ 13.0% - 13.5% ] 13.40% | 97 | 23.6% |
[ 13.5% - 14.0% ] 13.64% | 3,799 | 64.8% |
[ 13.5% - 14.0% ] 13.92% | 2,162 | 55.7% |
[ 14.0% - 14.5% ] 14.29% | 336 | 73.5% |
[ 14.5% - 15.0% ] 14.58% | 1,715 | 51.1% |
[ 14.5% - 15.0% ] 14.94% | 3,306 | 57.1% |
[ 15.0% - 15.5% ] 15.25% | 885 | 61.5% |
[ 15.0% - 15.5% ] 15.41% | 2,259 | 52.6% |
[ 15.5% - 16.0% ] 15.73% | 1,233 | 63.8% |
[ 15.5% - 16.0% ] 15.96% | 639 | 62.3% |
[ 16.0% - 16.5% ] 16.29% | 528 | 30.7% |
[ 16.5% - 17.0% ] 16.64% | 2,151 | 64.0% |
[ 16.5% - 17.0% ] 16.92% | 3,699 | 67.6% |
[ 17.0% - 17.5% ] 17.16% | 204 | 46.7% |
[ 17.5% - 18.0% ] 17.65% | 119 | 39.5% |
[ 17.5% - 18.0% ] 17.99% | 378 | 27.2% |
[ 19.0% - 19.5% ] 19.40% | 1,139 | 76.6% |
[ 20.0% - 20.5% ] 20.00% | 70 | 58.8% |
[ 20.0% - 20.5% ] 20.17% | 476 | 32.1% |
[ 20.5% - 21.0% ] 20.59% | 816 | 71.0% |
[ 20.5% - 21.0% ] 20.83% | 336 | 65.0% |
[ 21.0% - 21.5% ] 21.19% | 840 | 63.2% |
[ 21.5% - 22.0% ] 21.58% | 505 | 88.2% |
[ 21.5% - 22.0% ] 21.62% | 851 | 67.9% |
[ 23.0% - 23.5% ] 23.08% | 13 | 100.0% |
[ 23.0% - 23.5% ] 23.35% | 1,730 | 58.5% |
[ 23.5% - 24.0% ] 23.60% | 161 | 74.3% |
[ 24.5% - 25.0% ] 24.71% | 348 | 90.8% |
[ 25.0% - 25.5% ] 25.37% | 339 | 56.9% |
[ 26.0% - 26.5% ] 26.32% | 1,345 | 54.1% |
[ 27.0% - 27.5% ] 27.08% | 96 | 44.3% |
[ 27.0% - 27.5% ] 27.50% | 240 | 80.9% |
[ 27.5% - 28.0% ] 27.78% | 18 | 78.6% |
[ 28.0% - 28.5% ] 28.26% | 138 | 71.4% |
[ 28.5% - 29.0% ] 28.67% | 150 | 64.4% |
[ 29.0% - 29.5% ] 29.18% | 281 | 47.1% |
[ 31.0% - 31.5% ] 31.27% | 291 | 60.0% |
[ 36.0% - 36.5% ] 36.00% | 150 | 72.3% |
[ 37.5% - 38.0% ] 37.80% | 82 | 100.0% |
[ 38.0% - 38.5% ] 38.26% | 677 | 88.7% |
[ 49.0% - 49.5% ] 49.11% | 112 | 85.7% |
[ 50.0% - 50.5% ] 50.00% | 124 | 100.0% |
[ 60.0% - 60.5% ] 60.00% | 5 | 40.0% |
[ 63.5% - 64.0% ] 63.74% | 182 | 61.5% |