Slovak Disability Age Under 5
COMPARE
Slovak
Select to Compare
Disability Age Under 5
Slovak Disability Age Under 5
1.7%
DISABILITY | AGE UNDER 5
0.0/ 100
METRIC RATING
319th/ 347
METRIC RANK
Slovak Disability Age Under 5 Correlation Chart
The statistical analysis conducted on geographies consisting of 205,574,578 people shows a significant positive correlation between the proportion of Slovaks and percentage of population with a disability under the age of 5 in the United States with a correlation coefficient (R) of 0.691 and weighted average of 1.7%. On average, for every 1% (one percent) increase in Slovaks within a typical geography, there is an increase of 0.60% in percentage of population with a disability under the age of 5.
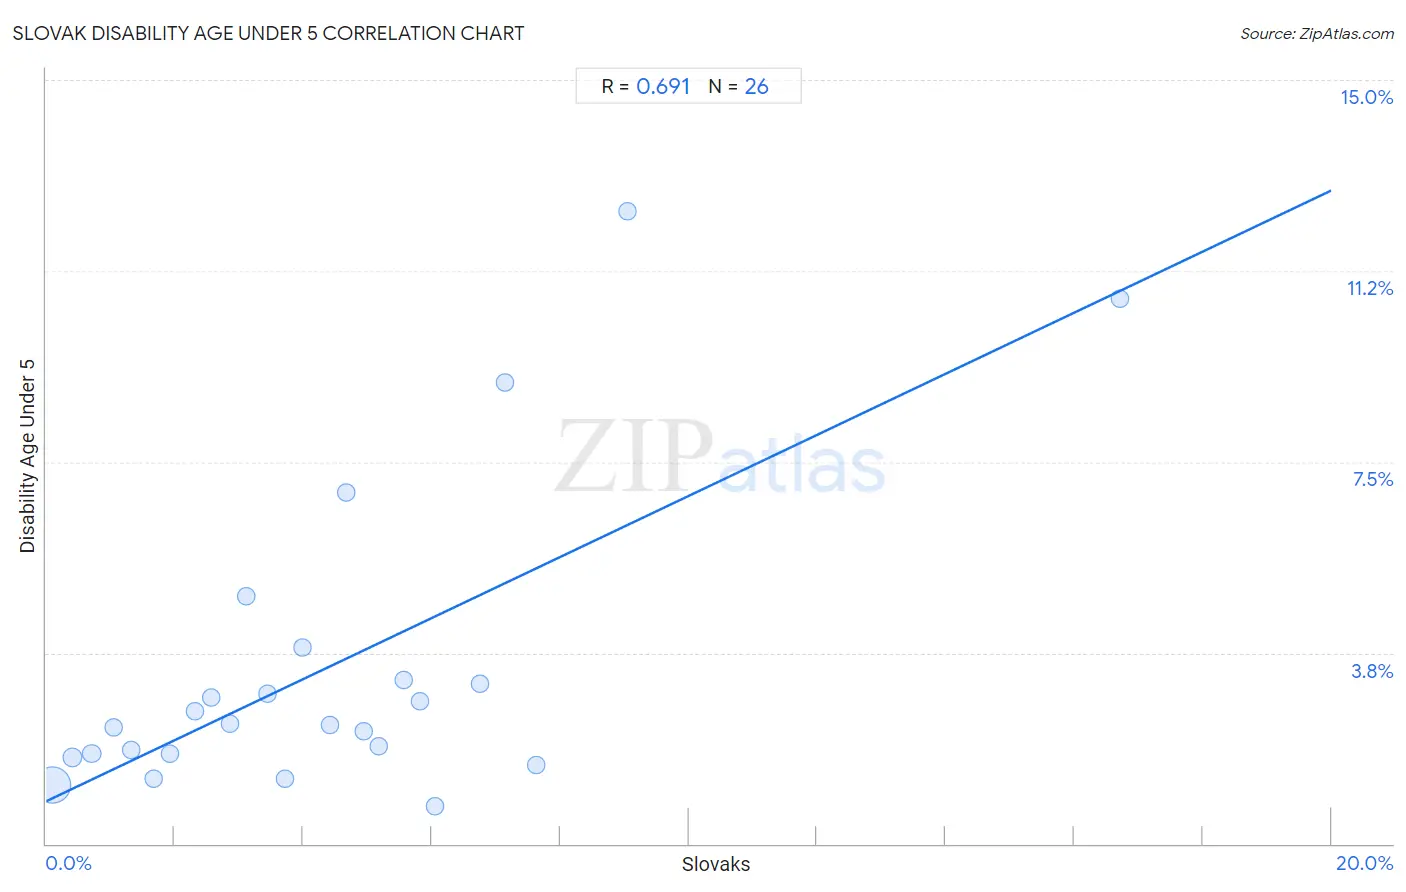
It is essential to understand that the correlation between the percentage of Slovaks and percentage of population with a disability under the age of 5 does not imply a direct cause-and-effect relationship. It remains uncertain whether the presence of Slovaks influences an upward or downward trend in the level of percentage of population with a disability under the age of 5 within an area, or if Slovaks simply ended up residing in those areas with higher or lower levels of percentage of population with a disability under the age of 5 due to other factors.
Demographics Similar to Slovaks by Disability Age Under 5
In terms of disability age under 5, the demographic groups most similar to Slovaks are Irish (1.7%, a difference of 0.31%), Scotch-Irish (1.7%, a difference of 0.53%), French (1.7%, a difference of 0.58%), Ottawa (1.7%, a difference of 0.59%), and Immigrants from Cabo Verde (1.7%, a difference of 1.0%).
| Demographics | Rating | Rank | Disability Age Under 5 |
| Puerto Ricans | 0.0 /100 | #312 | Tragic 1.7% |
| Celtics | 0.0 /100 | #313 | Tragic 1.7% |
| Norwegians | 0.0 /100 | #314 | Tragic 1.7% |
| Dutch | 0.0 /100 | #315 | Tragic 1.7% |
| Immigrants from Cabo Verde | 0.0 /100 | #316 | Tragic 1.7% |
| French | 0.0 /100 | #317 | Tragic 1.7% |
| Irish | 0.0 /100 | #318 | Tragic 1.7% |
| Slovaks | 0.0 /100 | #319 | Tragic 1.7% |
| Scotch-Irish | 0.0 /100 | #320 | Tragic 1.7% |
| Ottawa | 0.0 /100 | #321 | Tragic 1.7% |
| Germans | 0.0 /100 | #322 | Tragic 1.7% |
| Chickasaw | 0.0 /100 | #323 | Tragic 1.7% |
| Cherokee | 0.0 /100 | #324 | Tragic 1.8% |
| Immigrants from Portugal | 0.0 /100 | #325 | Tragic 1.8% |
| Sioux | 0.0 /100 | #326 | Tragic 1.8% |
Slovak Disability Age Under 5 Correlation Summary
| Measurement | Slovak Data | Disability Age Under 5 Data |
| Minimum | 0.091% | 0.73% |
| Maximum | 16.7% | 12.4% |
| Range | 16.6% | 11.7% |
| Mean | 4.3% | 3.4% |
| Median | 3.8% | 2.3% |
| Interquartile 25% (IQ1) | 1.9% | 1.8% |
| Interquartile 75% (IQ3) | 5.8% | 3.2% |
| Interquartile Range (IQR) | 3.9% | 1.4% |
| Standard Deviation (Sample) | 3.5% | 3.0% |
| Standard Deviation (Population) | 3.4% | 2.9% |
Correlation Details
| Slovak Percentile | Sample Size | Disability Age Under 5 |
[ 0.0% - 0.5% ] 0.091% | 182,750,500 | 1.2% |
[ 0.0% - 0.5% ] 0.41% | 13,470,077 | 1.7% |
[ 0.5% - 1.0% ] 0.71% | 3,508,185 | 1.8% |
[ 1.0% - 1.5% ] 1.05% | 1,696,100 | 2.3% |
[ 1.0% - 1.5% ] 1.33% | 866,452 | 1.8% |
[ 1.5% - 2.0% ] 1.68% | 774,838 | 1.3% |
[ 1.5% - 2.0% ] 1.92% | 386,240 | 1.8% |
[ 2.0% - 2.5% ] 2.31% | 463,722 | 2.6% |
[ 2.5% - 3.0% ] 2.57% | 206,481 | 2.9% |
[ 2.5% - 3.0% ] 2.86% | 285,500 | 2.4% |
[ 3.0% - 3.5% ] 3.12% | 150,140 | 4.9% |
[ 3.0% - 3.5% ] 3.44% | 217,537 | 2.9% |
[ 3.5% - 4.0% ] 3.71% | 213,489 | 1.3% |
[ 3.5% - 4.0% ] 3.98% | 67,598 | 3.8% |
[ 4.0% - 4.5% ] 4.41% | 68,125 | 2.3% |
[ 4.5% - 5.0% ] 4.66% | 48,570 | 6.9% |
[ 4.5% - 5.0% ] 4.94% | 92,939 | 2.2% |
[ 5.0% - 5.5% ] 5.17% | 106,678 | 1.9% |
[ 5.5% - 6.0% ] 5.56% | 12,206 | 3.2% |
[ 5.5% - 6.0% ] 5.82% | 60,704 | 2.8% |
[ 6.0% - 6.5% ] 6.04% | 28,851 | 0.73% |
[ 6.5% - 7.0% ] 6.74% | 37,155 | 3.1% |
[ 7.0% - 7.5% ] 7.14% | 6,067 | 9.0% |
[ 7.5% - 8.0% ] 7.63% | 50,404 | 1.5% |
[ 9.0% - 9.5% ] 9.04% | 5,021 | 12.4% |
[ 16.5% - 17.0% ] 16.72% | 999 | 10.7% |