Slovak 4 or more Vehicles in Household
COMPARE
Slovak
Select to Compare
4 or more Vehicles in Household
Slovak 4 or more Vehicles in Household
6.3%
4+ VEHICLES AVAILABLE
46.9/ 100
METRIC RATING
177th/ 347
METRIC RANK
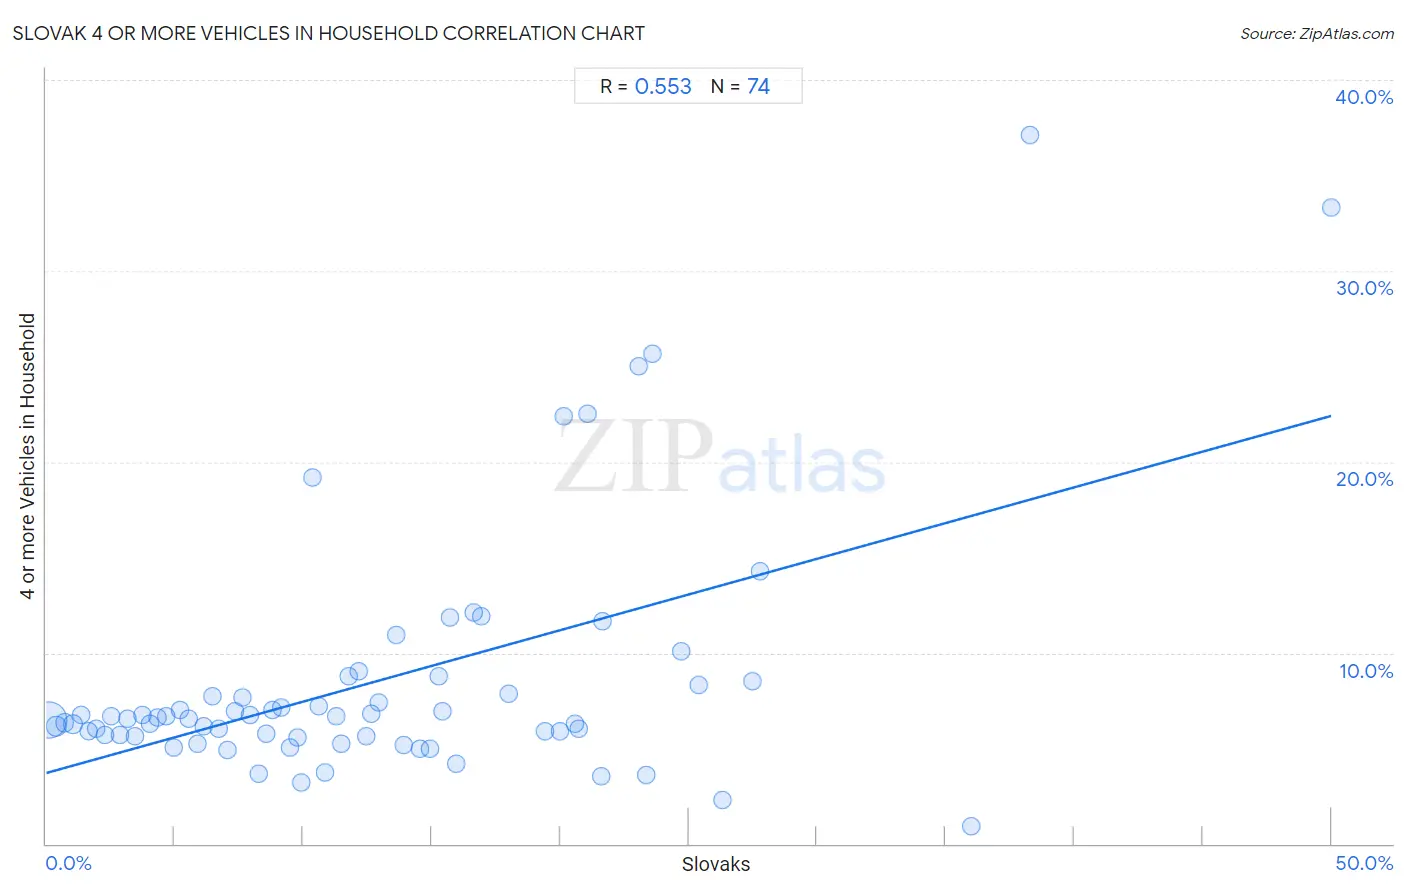
Slovak 4 or more Vehicles in Household Correlation Chart
The statistical analysis conducted on geographies consisting of 396,389,671 people shows a substantial positive correlation between the proportion of Slovaks and percentage of households with 4 or more vehicles available in the United States with a correlation coefficient (R) of 0.553 and weighted average of 6.3%. On average, for every 1% (one percent) increase in Slovaks within a typical geography, there is an increase of 0.37% in percentage of households with 4 or more vehicles available.
It is essential to understand that the correlation between the percentage of Slovaks and percentage of households with 4 or more vehicles available does not imply a direct cause-and-effect relationship. It remains uncertain whether the presence of Slovaks influences an upward or downward trend in the level of percentage of households with 4 or more vehicles available within an area, or if Slovaks simply ended up residing in those areas with higher or lower levels of percentage of households with 4 or more vehicles available due to other factors.
Demographics Similar to Slovaks by 4 or more Vehicles in Household
In terms of 4 or more vehicles in household, the demographic groups most similar to Slovaks are Ukrainian (6.3%, a difference of 0.070%), Immigrants from Western Europe (6.3%, a difference of 0.20%), Belizean (6.3%, a difference of 0.24%), Lithuanian (6.3%, a difference of 0.32%), and Immigrants from Japan (6.3%, a difference of 0.39%).
| Demographics | Rating | Rank | 4 or more Vehicles in Household |
| Immigrants from Syria | 52.8 /100 | #170 | Average 6.3% |
| Immigrants from India | 51.9 /100 | #171 | Average 6.3% |
| Immigrants from Lebanon | 51.7 /100 | #172 | Average 6.3% |
| Slovenes | 51.1 /100 | #173 | Average 6.3% |
| Lithuanians | 50.0 /100 | #174 | Average 6.3% |
| Immigrants from Western Europe | 48.8 /100 | #175 | Average 6.3% |
| Ukrainians | 47.6 /100 | #176 | Average 6.3% |
| Slovaks | 46.9 /100 | #177 | Average 6.3% |
| Belizeans | 44.5 /100 | #178 | Average 6.3% |
| Immigrants from Japan | 43.1 /100 | #179 | Average 6.3% |
| Syrians | 42.0 /100 | #180 | Average 6.3% |
| Yugoslavians | 41.1 /100 | #181 | Average 6.3% |
| South American Indians | 40.7 /100 | #182 | Average 6.3% |
| Immigrants from Burma/Myanmar | 37.5 /100 | #183 | Fair 6.2% |
| Iraqis | 37.3 /100 | #184 | Fair 6.2% |
Slovak 4 or more Vehicles in Household Correlation Summary
| Measurement | Slovak Data | 4 or more Vehicles in Household Data |
| Minimum | 0.10% | 0.89% |
| Maximum | 50.0% | 37.1% |
| Range | 49.9% | 36.2% |
| Mean | 12.9% | 8.5% |
| Median | 11.1% | 6.6% |
| Interquartile 25% (IQ1) | 5.5% | 5.6% |
| Interquartile 75% (IQ3) | 19.4% | 8.3% |
| Interquartile Range (IQR) | 13.9% | 2.7% |
| Standard Deviation (Sample) | 9.6% | 6.5% |
| Standard Deviation (Population) | 9.6% | 6.5% |
Correlation Details
| Slovak Percentile | Sample Size | 4 or more Vehicles in Household |
[ 0.0% - 0.5% ] 0.10% | 321,601,772 | 6.5% |
[ 0.0% - 0.5% ] 0.41% | 41,909,801 | 6.2% |
[ 0.5% - 1.0% ] 0.72% | 12,410,875 | 6.3% |
[ 1.0% - 1.5% ] 1.04% | 5,524,764 | 6.3% |
[ 1.0% - 1.5% ] 1.34% | 3,144,423 | 6.7% |
[ 1.5% - 2.0% ] 1.66% | 2,396,845 | 5.9% |
[ 1.5% - 2.0% ] 1.94% | 1,543,133 | 6.0% |
[ 2.0% - 2.5% ] 2.27% | 1,587,322 | 5.7% |
[ 2.5% - 3.0% ] 2.54% | 846,050 | 6.7% |
[ 2.5% - 3.0% ] 2.85% | 900,440 | 5.7% |
[ 3.0% - 3.5% ] 3.15% | 674,981 | 6.6% |
[ 3.0% - 3.5% ] 3.43% | 710,528 | 5.6% |
[ 3.5% - 4.0% ] 3.74% | 472,629 | 6.7% |
[ 4.0% - 4.5% ] 4.06% | 459,218 | 6.3% |
[ 4.0% - 4.5% ] 4.34% | 327,077 | 6.6% |
[ 4.5% - 5.0% ] 4.66% | 212,496 | 6.7% |
[ 4.5% - 5.0% ] 4.96% | 256,779 | 5.0% |
[ 5.0% - 5.5% ] 5.20% | 201,430 | 7.0% |
[ 5.5% - 6.0% ] 5.55% | 100,392 | 6.5% |
[ 5.5% - 6.0% ] 5.87% | 209,140 | 5.3% |
[ 6.0% - 6.5% ] 6.14% | 121,611 | 6.2% |
[ 6.0% - 6.5% ] 6.47% | 100,033 | 7.7% |
[ 6.5% - 7.0% ] 6.71% | 169,000 | 6.0% |
[ 7.0% - 7.5% ] 7.08% | 29,410 | 4.9% |
[ 7.0% - 7.5% ] 7.33% | 39,228 | 6.9% |
[ 7.5% - 8.0% ] 7.64% | 81,576 | 7.6% |
[ 7.5% - 8.0% ] 7.91% | 32,790 | 6.8% |
[ 8.0% - 8.5% ] 8.29% | 66,689 | 3.7% |
[ 8.5% - 9.0% ] 8.54% | 51,635 | 5.8% |
[ 8.5% - 9.0% ] 8.81% | 27,233 | 7.0% |
[ 9.0% - 9.5% ] 9.13% | 17,130 | 7.1% |
[ 9.0% - 9.5% ] 9.47% | 9,473 | 5.0% |
[ 9.5% - 10.0% ] 9.77% | 42,014 | 5.6% |
[ 9.5% - 10.0% ] 9.94% | 3,461 | 3.2% |
[ 10.0% - 10.5% ] 10.38% | 3,286 | 19.2% |
[ 10.5% - 11.0% ] 10.63% | 15,595 | 7.2% |
[ 10.5% - 11.0% ] 10.85% | 2,950 | 3.7% |
[ 11.0% - 11.5% ] 11.28% | 1,241 | 6.7% |
[ 11.0% - 11.5% ] 11.46% | 39,045 | 5.3% |
[ 11.5% - 12.0% ] 11.79% | 1,663 | 8.8% |
[ 12.0% - 12.5% ] 12.16% | 2,056 | 9.0% |
[ 12.0% - 12.5% ] 12.45% | 779 | 5.6% |
[ 12.5% - 13.0% ] 12.66% | 5,465 | 6.8% |
[ 12.5% - 13.0% ] 12.94% | 6,683 | 7.4% |
[ 13.5% - 14.0% ] 13.64% | 3,799 | 10.9% |
[ 13.5% - 14.0% ] 13.92% | 2,162 | 5.1% |
[ 14.5% - 15.0% ] 14.55% | 1,402 | 5.0% |
[ 14.5% - 15.0% ] 14.95% | 3,004 | 5.0% |
[ 15.0% - 15.5% ] 15.29% | 569 | 8.8% |
[ 15.0% - 15.5% ] 15.40% | 1,753 | 6.9% |
[ 15.5% - 16.0% ] 15.71% | 624 | 11.9% |
[ 15.5% - 16.0% ] 15.96% | 639 | 4.2% |
[ 16.5% - 17.0% ] 16.64% | 2,151 | 12.1% |
[ 16.5% - 17.0% ] 16.92% | 3,699 | 11.9% |
[ 17.5% - 18.0% ] 17.99% | 378 | 7.8% |
[ 19.0% - 19.5% ] 19.40% | 1,139 | 5.9% |
[ 20.0% - 20.5% ] 20.00% | 70 | 5.9% |
[ 20.0% - 20.5% ] 20.15% | 402 | 22.4% |
[ 20.5% - 21.0% ] 20.58% | 690 | 6.3% |
[ 20.5% - 21.0% ] 20.71% | 140 | 6.0% |
[ 21.0% - 21.5% ] 21.08% | 408 | 22.5% |
[ 21.5% - 22.0% ] 21.58% | 505 | 3.6% |
[ 21.5% - 22.0% ] 21.62% | 851 | 11.6% |
[ 23.0% - 23.5% ] 23.08% | 13 | 25.0% |
[ 23.0% - 23.5% ] 23.35% | 1,730 | 3.6% |
[ 23.5% - 24.0% ] 23.60% | 161 | 25.7% |
[ 24.5% - 25.0% ] 24.71% | 348 | 10.1% |
[ 25.0% - 25.5% ] 25.37% | 339 | 8.3% |
[ 26.0% - 26.5% ] 26.32% | 1,345 | 2.3% |
[ 27.0% - 27.5% ] 27.50% | 240 | 8.5% |
[ 27.5% - 28.0% ] 27.78% | 18 | 14.3% |
[ 36.0% - 36.5% ] 36.00% | 150 | 0.89% |
[ 38.0% - 38.5% ] 38.26% | 677 | 37.1% |
[ 50.0% - 50.5% ] 50.00% | 124 | 33.3% |