Slovak College, Under 1 year
COMPARE
Slovak
Select to Compare
College, Under 1 year
Slovak College, Under 1 year
64.7%
COLLEGE, UNDER 1 YEAR
26.7/ 100
METRIC RATING
193rd/ 347
METRIC RANK
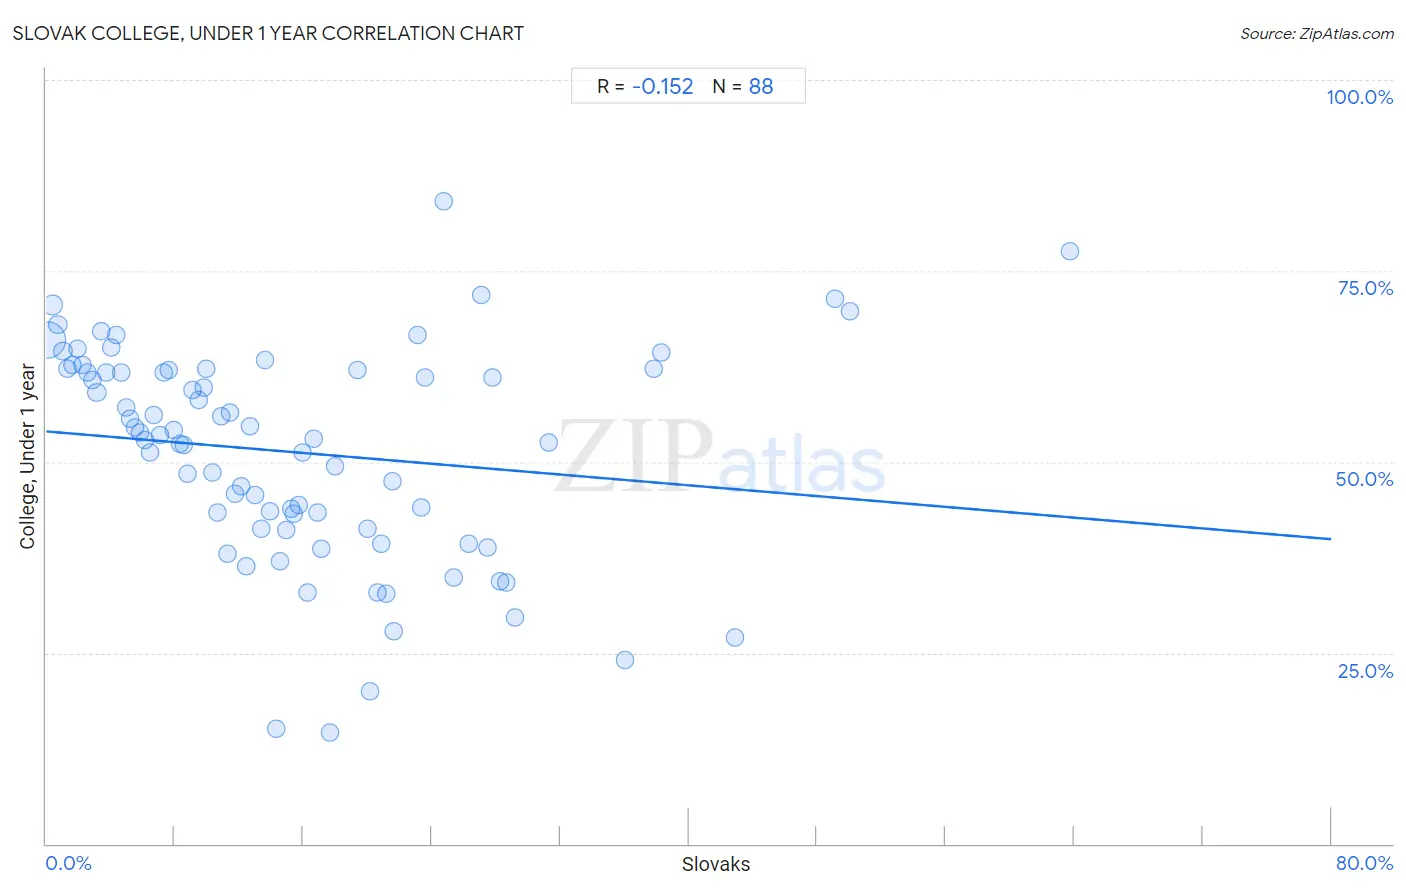
Slovak College, Under 1 year Correlation Chart
The statistical analysis conducted on geographies consisting of 397,891,856 people shows a poor negative correlation between the proportion of Slovaks and percentage of population with at least college, under 1 year education in the United States with a correlation coefficient (R) of -0.152 and weighted average of 64.7%. On average, for every 1% (one percent) increase in Slovaks within a typical geography, there is a decrease of 0.18% in percentage of population with at least college, under 1 year education.
It is essential to understand that the correlation between the percentage of Slovaks and percentage of population with at least college, under 1 year education does not imply a direct cause-and-effect relationship. It remains uncertain whether the presence of Slovaks influences an upward or downward trend in the level of percentage of population with at least college, under 1 year education within an area, or if Slovaks simply ended up residing in those areas with higher or lower levels of percentage of population with at least college, under 1 year education due to other factors.
Demographics Similar to Slovaks by College, Under 1 year
In terms of college, under 1 year, the demographic groups most similar to Slovaks are Immigrants from Thailand (64.7%, a difference of 0.020%), Immigrants from Armenia (64.7%, a difference of 0.070%), Immigrants from Cameroon (64.6%, a difference of 0.13%), Immigrants from Philippines (64.8%, a difference of 0.19%), and Spanish (64.9%, a difference of 0.26%).
| Demographics | Rating | Rank | College, Under 1 year |
| Immigrants from Sierra Leone | 39.7 /100 | #186 | Fair 65.1% |
| Immigrants from Southern Europe | 34.3 /100 | #187 | Fair 64.9% |
| Immigrants from Albania | 32.0 /100 | #188 | Fair 64.9% |
| Spanish | 31.6 /100 | #189 | Fair 64.9% |
| Immigrants from Philippines | 30.1 /100 | #190 | Fair 64.8% |
| Immigrants from Armenia | 28.1 /100 | #191 | Fair 64.7% |
| Immigrants from Thailand | 27.0 /100 | #192 | Fair 64.7% |
| Slovaks | 26.7 /100 | #193 | Fair 64.7% |
| Immigrants from Cameroon | 24.6 /100 | #194 | Fair 64.6% |
| Immigrants from South Eastern Asia | 22.1 /100 | #195 | Fair 64.5% |
| Tongans | 21.2 /100 | #196 | Fair 64.5% |
| Costa Ricans | 19.6 /100 | #197 | Poor 64.4% |
| Tsimshian | 17.9 /100 | #198 | Poor 64.3% |
| Panamanians | 17.0 /100 | #199 | Poor 64.3% |
| Nigerians | 16.7 /100 | #200 | Poor 64.3% |
Slovak College, Under 1 year Correlation Summary
| Measurement | Slovak Data | College, Under 1 year Data |
| Minimum | 0.10% | 14.5% |
| Maximum | 63.7% | 84.1% |
| Range | 63.6% | 69.5% |
| Mean | 15.6% | 51.3% |
| Median | 13.2% | 53.3% |
| Interquartile 25% (IQ1) | 6.6% | 41.2% |
| Interquartile 75% (IQ3) | 21.4% | 62.0% |
| Interquartile Range (IQR) | 14.8% | 20.8% |
| Standard Deviation (Sample) | 12.2% | 14.1% |
| Standard Deviation (Population) | 12.1% | 14.0% |
Correlation Details
| Slovak Percentile | Sample Size | College, Under 1 year |
[ 0.0% - 0.5% ] 0.10% | 322,433,163 | 66.0% |
[ 0.0% - 0.5% ] 0.41% | 42,210,352 | 70.5% |
[ 0.5% - 1.0% ] 0.72% | 12,596,431 | 67.9% |
[ 1.0% - 1.5% ] 1.04% | 5,580,291 | 64.5% |
[ 1.0% - 1.5% ] 1.34% | 3,176,525 | 62.3% |
[ 1.5% - 2.0% ] 1.66% | 2,409,765 | 62.7% |
[ 1.5% - 2.0% ] 1.94% | 1,550,519 | 64.9% |
[ 2.0% - 2.5% ] 2.27% | 1,592,059 | 62.7% |
[ 2.5% - 3.0% ] 2.54% | 860,255 | 61.7% |
[ 2.5% - 3.0% ] 2.85% | 903,420 | 60.7% |
[ 3.0% - 3.5% ] 3.15% | 681,261 | 59.0% |
[ 3.0% - 3.5% ] 3.43% | 712,832 | 67.1% |
[ 3.5% - 4.0% ] 3.74% | 478,761 | 61.7% |
[ 4.0% - 4.5% ] 4.06% | 462,311 | 65.0% |
[ 4.0% - 4.5% ] 4.34% | 330,090 | 66.6% |
[ 4.5% - 5.0% ] 4.66% | 214,240 | 61.7% |
[ 4.5% - 5.0% ] 4.96% | 258,732 | 57.1% |
[ 5.0% - 5.5% ] 5.20% | 202,255 | 55.7% |
[ 5.5% - 6.0% ] 5.55% | 103,859 | 54.4% |
[ 5.5% - 6.0% ] 5.87% | 210,556 | 53.8% |
[ 6.0% - 6.5% ] 6.14% | 122,690 | 52.9% |
[ 6.0% - 6.5% ] 6.48% | 101,816 | 51.3% |
[ 6.5% - 7.0% ] 6.71% | 170,716 | 56.2% |
[ 7.0% - 7.5% ] 7.08% | 35,202 | 53.5% |
[ 7.0% - 7.5% ] 7.33% | 41,899 | 61.7% |
[ 7.5% - 8.0% ] 7.64% | 81,898 | 62.0% |
[ 7.5% - 8.0% ] 7.91% | 33,000 | 54.2% |
[ 8.0% - 8.5% ] 8.29% | 67,145 | 52.4% |
[ 8.5% - 9.0% ] 8.54% | 51,836 | 52.2% |
[ 8.5% - 9.0% ] 8.81% | 27,729 | 48.4% |
[ 9.0% - 9.5% ] 9.13% | 17,809 | 59.5% |
[ 9.0% - 9.5% ] 9.47% | 9,473 | 58.1% |
[ 9.5% - 10.0% ] 9.77% | 42,065 | 59.8% |
[ 9.5% - 10.0% ] 9.94% | 3,461 | 62.2% |
[ 10.0% - 10.5% ] 10.38% | 3,286 | 48.7% |
[ 10.5% - 11.0% ] 10.62% | 16,369 | 43.4% |
[ 10.5% - 11.0% ] 10.87% | 3,669 | 56.0% |
[ 11.0% - 11.5% ] 11.27% | 1,340 | 38.0% |
[ 11.0% - 11.5% ] 11.46% | 39,331 | 56.4% |
[ 11.5% - 12.0% ] 11.79% | 1,663 | 45.8% |
[ 12.0% - 12.5% ] 12.16% | 2,640 | 46.9% |
[ 12.0% - 12.5% ] 12.42% | 1,208 | 36.4% |
[ 12.5% - 13.0% ] 12.66% | 5,465 | 54.7% |
[ 12.5% - 13.0% ] 12.96% | 7,216 | 45.7% |
[ 13.0% - 13.5% ] 13.40% | 97 | 41.2% |
[ 13.5% - 14.0% ] 13.64% | 3,843 | 63.4% |
[ 13.5% - 14.0% ] 13.92% | 2,162 | 43.5% |
[ 14.0% - 14.5% ] 14.29% | 336 | 15.1% |
[ 14.5% - 15.0% ] 14.58% | 1,715 | 37.1% |
[ 14.5% - 15.0% ] 14.94% | 3,306 | 41.1% |
[ 15.0% - 15.5% ] 15.25% | 885 | 43.9% |
[ 15.0% - 15.5% ] 15.41% | 2,259 | 43.2% |
[ 15.5% - 16.0% ] 15.73% | 1,233 | 44.3% |
[ 15.5% - 16.0% ] 15.96% | 639 | 51.2% |
[ 16.0% - 16.5% ] 16.29% | 528 | 32.9% |
[ 16.5% - 17.0% ] 16.64% | 2,151 | 53.0% |
[ 16.5% - 17.0% ] 16.92% | 3,699 | 43.3% |
[ 17.0% - 17.5% ] 17.16% | 204 | 38.6% |
[ 17.5% - 18.0% ] 17.65% | 119 | 14.5% |
[ 17.5% - 18.0% ] 17.99% | 378 | 49.4% |
[ 19.0% - 19.5% ] 19.40% | 1,139 | 62.1% |
[ 20.0% - 20.5% ] 20.00% | 70 | 41.2% |
[ 20.0% - 20.5% ] 20.17% | 476 | 19.9% |
[ 20.5% - 21.0% ] 20.59% | 816 | 32.8% |
[ 20.5% - 21.0% ] 20.83% | 336 | 39.2% |
[ 21.0% - 21.5% ] 21.19% | 840 | 32.7% |
[ 21.5% - 22.0% ] 21.58% | 505 | 47.4% |
[ 21.5% - 22.0% ] 21.62% | 851 | 27.9% |
[ 23.0% - 23.5% ] 23.08% | 13 | 66.7% |
[ 23.0% - 23.5% ] 23.35% | 1,730 | 44.1% |
[ 23.5% - 24.0% ] 23.60% | 161 | 61.0% |
[ 24.5% - 25.0% ] 24.71% | 348 | 84.1% |
[ 25.0% - 25.5% ] 25.37% | 339 | 34.8% |
[ 26.0% - 26.5% ] 26.32% | 1,345 | 39.2% |
[ 27.0% - 27.5% ] 27.08% | 96 | 71.9% |
[ 27.0% - 27.5% ] 27.50% | 240 | 38.8% |
[ 27.5% - 28.0% ] 27.78% | 18 | 61.1% |
[ 28.0% - 28.5% ] 28.26% | 138 | 34.4% |
[ 28.5% - 29.0% ] 28.67% | 150 | 34.3% |
[ 29.0% - 29.5% ] 29.18% | 281 | 29.7% |
[ 31.0% - 31.5% ] 31.27% | 291 | 52.5% |
[ 36.0% - 36.5% ] 36.00% | 150 | 24.1% |
[ 37.5% - 38.0% ] 37.80% | 82 | 62.2% |
[ 38.0% - 38.5% ] 38.26% | 677 | 64.4% |
[ 42.5% - 43.0% ] 42.86% | 189 | 27.0% |
[ 49.0% - 49.5% ] 49.11% | 112 | 71.4% |
[ 50.0% - 50.5% ] 50.00% | 124 | 69.7% |
[ 63.5% - 64.0% ] 63.74% | 182 | 77.6% |