Slovak Unemployment Among Women with Children Ages 6 to 17 years
COMPARE
Slovak
Select to Compare
Unemployment Among Women with Children Ages 6 to 17 years
Slovak Unemployment Among Women with Children Ages 6 to 17 years
9.8%
UNEMPLOYMENT | WOMEN W/ CHILDREN 6 TO 17
0.0/ 100
METRIC RATING
282nd/ 347
METRIC RANK
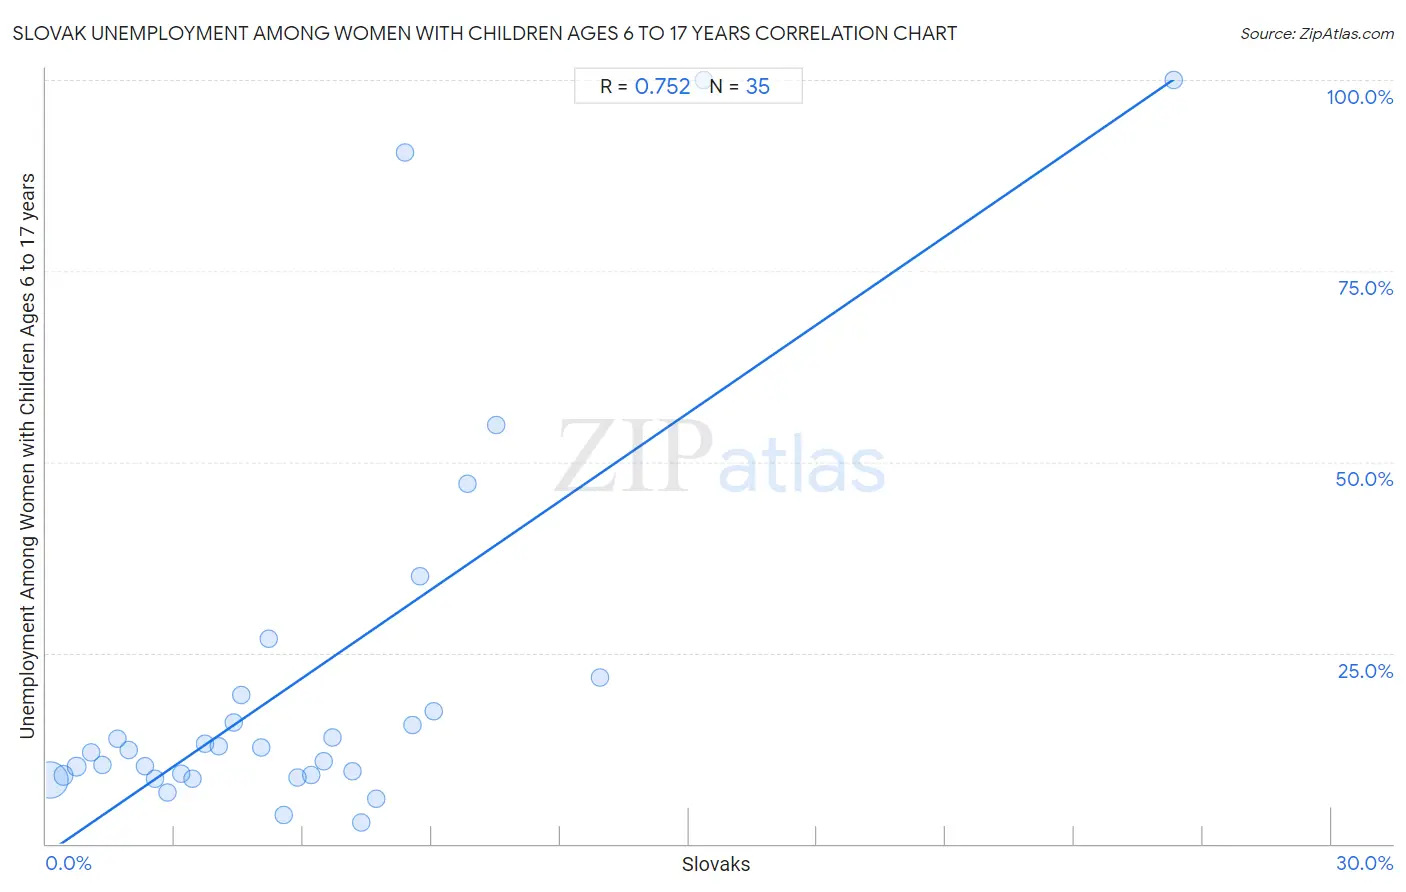
Slovak Unemployment Among Women with Children Ages 6 to 17 years Correlation Chart
The statistical analysis conducted on geographies consisting of 272,612,741 people shows a strong positive correlation between the proportion of Slovaks and unemployment rate among women with children between the ages 6 and 17 in the United States with a correlation coefficient (R) of 0.752 and weighted average of 9.8%. On average, for every 1% (one percent) increase in Slovaks within a typical geography, there is an increase of 3.9% in unemployment rate among women with children between the ages 6 and 17.
It is essential to understand that the correlation between the percentage of Slovaks and unemployment rate among women with children between the ages 6 and 17 does not imply a direct cause-and-effect relationship. It remains uncertain whether the presence of Slovaks influences an upward or downward trend in the level of unemployment rate among women with children between the ages 6 and 17 within an area, or if Slovaks simply ended up residing in those areas with higher or lower levels of unemployment rate among women with children between the ages 6 and 17 due to other factors.
Demographics Similar to Slovaks by Unemployment Among Women with Children Ages 6 to 17 years
In terms of unemployment among women with children ages 6 to 17 years, the demographic groups most similar to Slovaks are Jamaican (9.8%, a difference of 0.23%), Seminole (9.7%, a difference of 0.76%), Central American Indian (9.9%, a difference of 0.83%), Scotch-Irish (9.7%, a difference of 0.95%), and Yakama (9.9%, a difference of 0.98%).
| Demographics | Rating | Rank | Unemployment Among Women with Children Ages 6 to 17 years |
| U.S. Virgin Islanders | 0.1 /100 | #275 | Tragic 9.7% |
| Immigrants from Portugal | 0.1 /100 | #276 | Tragic 9.7% |
| British West Indians | 0.1 /100 | #277 | Tragic 9.7% |
| French | 0.1 /100 | #278 | Tragic 9.7% |
| Scotch-Irish | 0.1 /100 | #279 | Tragic 9.7% |
| Seminole | 0.1 /100 | #280 | Tragic 9.7% |
| Jamaicans | 0.0 /100 | #281 | Tragic 9.8% |
| Slovaks | 0.0 /100 | #282 | Tragic 9.8% |
| Central American Indians | 0.0 /100 | #283 | Tragic 9.9% |
| Yakama | 0.0 /100 | #284 | Tragic 9.9% |
| Hispanics or Latinos | 0.0 /100 | #285 | Tragic 9.9% |
| Choctaw | 0.0 /100 | #286 | Tragic 9.9% |
| Sierra Leoneans | 0.0 /100 | #287 | Tragic 9.9% |
| Shoshone | 0.0 /100 | #288 | Tragic 10.0% |
| Hondurans | 0.0 /100 | #289 | Tragic 10.0% |
Slovak Unemployment Among Women with Children Ages 6 to 17 years Correlation Summary
| Measurement | Slovak Data | Unemployment Among Women with Children Ages 6 to 17 years Data |
| Minimum | 0.093% | 2.7% |
| Maximum | 26.3% | 100.0% |
| Range | 26.2% | 97.3% |
| Mean | 6.0% | 21.9% |
| Median | 5.2% | 12.3% |
| Interquartile 25% (IQ1) | 2.5% | 8.9% |
| Interquartile 75% (IQ3) | 8.4% | 19.5% |
| Interquartile Range (IQR) | 5.8% | 10.5% |
| Standard Deviation (Sample) | 5.0% | 25.8% |
| Standard Deviation (Population) | 5.0% | 25.4% |
Correlation Details
| Slovak Percentile | Sample Size | Unemployment Among Women with Children Ages 6 to 17 years |
[ 0.0% - 0.5% ] 0.093% | 236,665,829 | 8.4% |
[ 0.0% - 0.5% ] 0.41% | 21,302,106 | 8.9% |
[ 0.5% - 1.0% ] 0.71% | 5,661,504 | 10.1% |
[ 1.0% - 1.5% ] 1.05% | 2,607,481 | 12.0% |
[ 1.0% - 1.5% ] 1.32% | 1,379,395 | 10.3% |
[ 1.5% - 2.0% ] 1.67% | 1,133,496 | 13.8% |
[ 1.5% - 2.0% ] 1.93% | 737,655 | 12.3% |
[ 2.0% - 2.5% ] 2.30% | 770,773 | 10.2% |
[ 2.5% - 3.0% ] 2.53% | 332,445 | 8.5% |
[ 2.5% - 3.0% ] 2.84% | 373,135 | 6.7% |
[ 3.0% - 3.5% ] 3.14% | 318,239 | 9.2% |
[ 3.0% - 3.5% ] 3.43% | 270,849 | 8.5% |
[ 3.5% - 4.0% ] 3.72% | 97,734 | 13.1% |
[ 4.0% - 4.5% ] 4.02% | 191,791 | 12.7% |
[ 4.0% - 4.5% ] 4.37% | 121,755 | 15.9% |
[ 4.5% - 5.0% ] 4.56% | 53,135 | 19.5% |
[ 5.0% - 5.5% ] 5.02% | 94,822 | 12.6% |
[ 5.0% - 5.5% ] 5.19% | 27,411 | 26.8% |
[ 5.5% - 6.0% ] 5.56% | 51,267 | 3.8% |
[ 5.5% - 6.0% ] 5.86% | 148,941 | 8.7% |
[ 6.0% - 6.5% ] 6.17% | 22,219 | 8.9% |
[ 6.0% - 6.5% ] 6.47% | 57,283 | 10.8% |
[ 6.5% - 7.0% ] 6.69% | 90,077 | 13.9% |
[ 7.0% - 7.5% ] 7.16% | 6,494 | 9.4% |
[ 7.0% - 7.5% ] 7.34% | 20,171 | 2.7% |
[ 7.5% - 8.0% ] 7.71% | 29,612 | 5.9% |
[ 8.0% - 8.5% ] 8.37% | 3,548 | 90.5% |
[ 8.5% - 9.0% ] 8.54% | 14,963 | 15.6% |
[ 8.5% - 9.0% ] 8.72% | 9,767 | 35.1% |
[ 9.0% - 9.5% ] 9.04% | 5,021 | 17.3% |
[ 9.5% - 10.0% ] 9.84% | 2,430 | 47.2% |
[ 10.5% - 11.0% ] 10.51% | 4,919 | 54.9% |
[ 12.5% - 13.0% ] 12.94% | 4,328 | 21.7% |
[ 15.0% - 15.5% ] 15.36% | 801 | 100.0% |
[ 26.0% - 26.5% ] 26.32% | 1,345 | 100.0% |