Slovak Married-Couple Family Poverty

COMPARE

Slovak
Race
Ancestry
AfghanAfricanAlaska NativeAlaskan AthabascanAlbanianAleutAlsatianAmericanApacheArabArapahoArgentineanArmenianAssyrian/Chaldean/SyriacAustralianAustrianBahamianBangladeshiBarbadianBasqueBelgianBelizeanBermudanBhutaneseBlackfeetBolivianBrazilianBritishBritish West IndianBulgarianBurmeseCajunCambodianCanadianCape VerdeanCarpatho RusynCelticCentral AmericanCentral American IndianCherokeeCheyenneChickasawChileanChineseChippewaChoctawColombianColvilleComancheCosta RicanCreeCreekCroatianCrowCubanCypriotCzechCzechoslovakianDanishDelawareDominicanDutchDutch West IndianEastern EuropeanEcuadorianEgyptianEnglishEstonianEthiopianEuropeanFijianFilipinoFinnishFrenchFrench American IndianFrench CanadianGermanGerman RussianGhanaianGreekGuamanian/ChamorroGuatemalanGuyaneseHaitianHmongHonduranHopiHoumaHungarianIcelanderIndian (Asian)IndonesianInupiatIranianIraqiIrishIroquoisIsraeliItalianJamaicanJapaneseJordanianKenyanKiowaKoreanLaotianLatvianLebaneseLiberianLithuanianLumbeeLuxembourgerMacedonianMalaysianMalteseMarshalleseMenomineeMexicanMexican American IndianMongolianMoroccanNative HawaiianNavajoNepaleseNew ZealanderNicaraguanNigerianNorthern EuropeanNorwegianOkinawanOsageOttawaPaiutePakistaniPalestinianPanamanianParaguayanPennsylvania GermanPeruvianPimaPolishPortuguesePotawatomiPuebloPuerto RicanPuget Sound SalishRomanianRussianSalvadoranSamoanScandinavianScotch-IrishScottishSeminoleSenegaleseSerbianShoshoneSierra LeoneanSiouxSlavicSlovakSloveneSomaliSouth AfricanSouth AmericanSouth American IndianSoviet UnionSpaniardSpanishSpanish AmericanSpanish American IndianSri LankanSubsaharan AfricanSudaneseSwedishSwissSyrianTaiwaneseThaiTlingit-HaidaTohono O'OdhamTonganTrinidadian and TobagonianTsimshianTurkishU.S. Virgin IslanderUgandanUkrainianUruguayanUteVenezuelanVietnameseWelshWest IndianYakamaYaquiYugoslavianYumanYup'ikZimbabwean
Immigration
NonimmigrantsImmigrantsAfghanistanAfricaAlbaniaArgentinaArmeniaAsiaAustraliaAustriaBahamasBangladeshBarbadosBelarusBelgiumBelizeBoliviaBosnia and HerzegovinaBrazilBulgariaBurma/MyanmarCabo VerdeCambodiaCameroonCanadaCaribbeanCentral AmericaChileChinaColombiaCongoCosta RicaCroatiaCubaCzechoslovakiaDenmarkDominicaDominican RepublicEastern AfricaEastern AsiaEastern EuropeEcuadorEgyptEl SalvadorEnglandEritreaEthiopiaEuropeFijiFranceGermanyGhanaGreeceGrenadaGuatemalaGuyanaHaitiHondurasHong KongHungaryIndiaIndonesiaIranIraqIrelandIsraelItalyJamaicaJapanJordanKazakhstanKenyaKoreaKuwaitLaosLatin AmericaLatviaLebanonLiberiaLithuaniaMalaysiaMexicoMicronesiaMiddle AfricaMoldovaMoroccoNepalNetherlandsNicaraguaNigeriaNorth AmericaNorth MacedoniaNorthern AfricaNorthern EuropeNorwayOceaniaPakistanPanamaPeruPhilippinesPolandPortugalRomaniaRussiaSaudi ArabiaScotlandSenegalSerbiaSierra LeoneSingaporeSomaliaSouth AfricaSouth AmericaSouth Central AsiaSouth Eastern AsiaSouthern EuropeSpainSri LankaSt. Vincent and the GrenadinesSudanSwedenSwitzerlandSyriaTaiwanThailandTrinidad and TobagoTurkeyUgandaUkraineUruguayUzbekistanVenezuelaVietnamWest IndiesWestern AfricaWestern AsiaWestern EuropeYemenZaireZimbabweAzores
Select to Compare
Race
Ancestry
AfghanAfricanAlaska NativeAlaskan AthabascanAlbanianAleutAlsatianAmericanApacheArabArapahoArgentineanArmenianAssyrian/Chaldean/SyriacAustralianAustrianBahamianBangladeshiBarbadianBasqueBelgianBelizeanBermudanBhutaneseBlackfeetBolivianBrazilianBritishBritish West IndianBulgarianBurmeseCajunCambodianCanadianCape VerdeanCarpatho RusynCelticCentral AmericanCentral American IndianCherokeeCheyenneChickasawChileanChineseChippewaChoctawColombianColvilleComancheCosta RicanCreeCreekCroatianCrowCubanCypriotCzechCzechoslovakianDanishDelawareDominicanDutchDutch West IndianEastern EuropeanEcuadorianEgyptianEnglishEstonianEthiopianEuropeanFijianFilipinoFinnishFrenchFrench American IndianFrench CanadianGermanGerman RussianGhanaianGreekGuamanian/ChamorroGuatemalanGuyaneseHaitianHmongHonduranHopiHoumaHungarianIcelanderIndian (Asian)IndonesianInupiatIranianIraqiIrishIroquoisIsraeliItalianJamaicanJapaneseJordanianKenyanKiowaKoreanLaotianLatvianLebaneseLiberianLithuanianLumbeeLuxembourgerMacedonianMalaysianMalteseMarshalleseMenomineeMexicanMexican American IndianMongolianMoroccanNative HawaiianNavajoNepaleseNew ZealanderNicaraguanNigerianNorthern EuropeanNorwegianOkinawanOsageOttawaPaiutePakistaniPalestinianPanamanianParaguayanPennsylvania GermanPeruvianPimaPolishPortuguesePotawatomiPuebloPuerto RicanPuget Sound SalishRomanianRussianSalvadoranSamoanScandinavianScotch-IrishScottishSeminoleSenegaleseSerbianShoshoneSierra LeoneanSiouxSlavicSloveneSomaliSouth AfricanSouth AmericanSouth American IndianSoviet UnionSpaniardSpanishSpanish AmericanSpanish American IndianSri LankanSubsaharan AfricanSudaneseSwedishSwissSyrianTaiwaneseThaiTlingit-HaidaTohono O'OdhamTonganTrinidadian and TobagonianTsimshianTurkishU.S. Virgin IslanderUgandanUkrainianUruguayanUteVenezuelanVietnameseWelshWest IndianYakamaYaquiYugoslavianYumanYup'ikZimbabwean
Immigration
NonimmigrantsImmigrantsAfghanistanAfricaAlbaniaArgentinaArmeniaAsiaAustraliaAustriaBahamasBangladeshBarbadosBelarusBelgiumBelizeBoliviaBosnia and HerzegovinaBrazilBulgariaBurma/MyanmarCabo VerdeCambodiaCameroonCanadaCaribbeanCentral AmericaChileChinaColombiaCongoCosta RicaCroatiaCubaCzechoslovakiaDenmarkDominicaDominican RepublicEastern AfricaEastern AsiaEastern EuropeEcuadorEgyptEl SalvadorEnglandEritreaEthiopiaEuropeFijiFranceGermanyGhanaGreeceGrenadaGuatemalaGuyanaHaitiHondurasHong KongHungaryIndiaIndonesiaIranIraqIrelandIsraelItalyJamaicaJapanJordanKazakhstanKenyaKoreaKuwaitLaosLatin AmericaLatviaLebanonLiberiaLithuaniaMalaysiaMexicoMicronesiaMiddle AfricaMoldovaMoroccoNepalNetherlandsNicaraguaNigeriaNorth AmericaNorth MacedoniaNorthern AfricaNorthern EuropeNorwayOceaniaPakistanPanamaPeruPhilippinesPolandPortugalRomaniaRussiaSaudi ArabiaScotlandSenegalSerbiaSierra LeoneSingaporeSomaliaSouth AfricaSouth AmericaSouth Central AsiaSouth Eastern AsiaSouthern EuropeSpainSri LankaSt. Vincent and the GrenadinesSudanSwedenSwitzerlandSyriaTaiwanThailandTrinidad and TobagoTurkeyUgandaUkraineUruguayUzbekistanVenezuelaVietnamWest IndiesWestern AfricaWestern AsiaWestern EuropeYemenZaireZimbabweAzores
Married-Couple Family Poverty
Income
Poverty
Unemployment
Labor Participation
Family Structure
Vehicle Availability
Education Level
Disability

Slovak Married-Couple Family Poverty
Exceptional

4.0%
POVERTY | MARRIED-COUPLE FAMILIES
100.0/ 100
METRIC RATING
14th/ 347
METRIC RANK

Slovak Married-Couple Family Poverty Correlation Chart

The statistical analysis conducted on geographies consisting of 392,761,717 people shows a substantial positive correlation between the proportion of Slovaks and poverty level among married-couple families in the United States with a correlation coefficient (R) of 0.588 and weighted average of 4.0%. On average, for every 1% (one percent) increase in Slovaks within a typical geography, there is an increase of 0.31% in poverty level among married-couple families.
Slovak Married-Couple Family Poverty
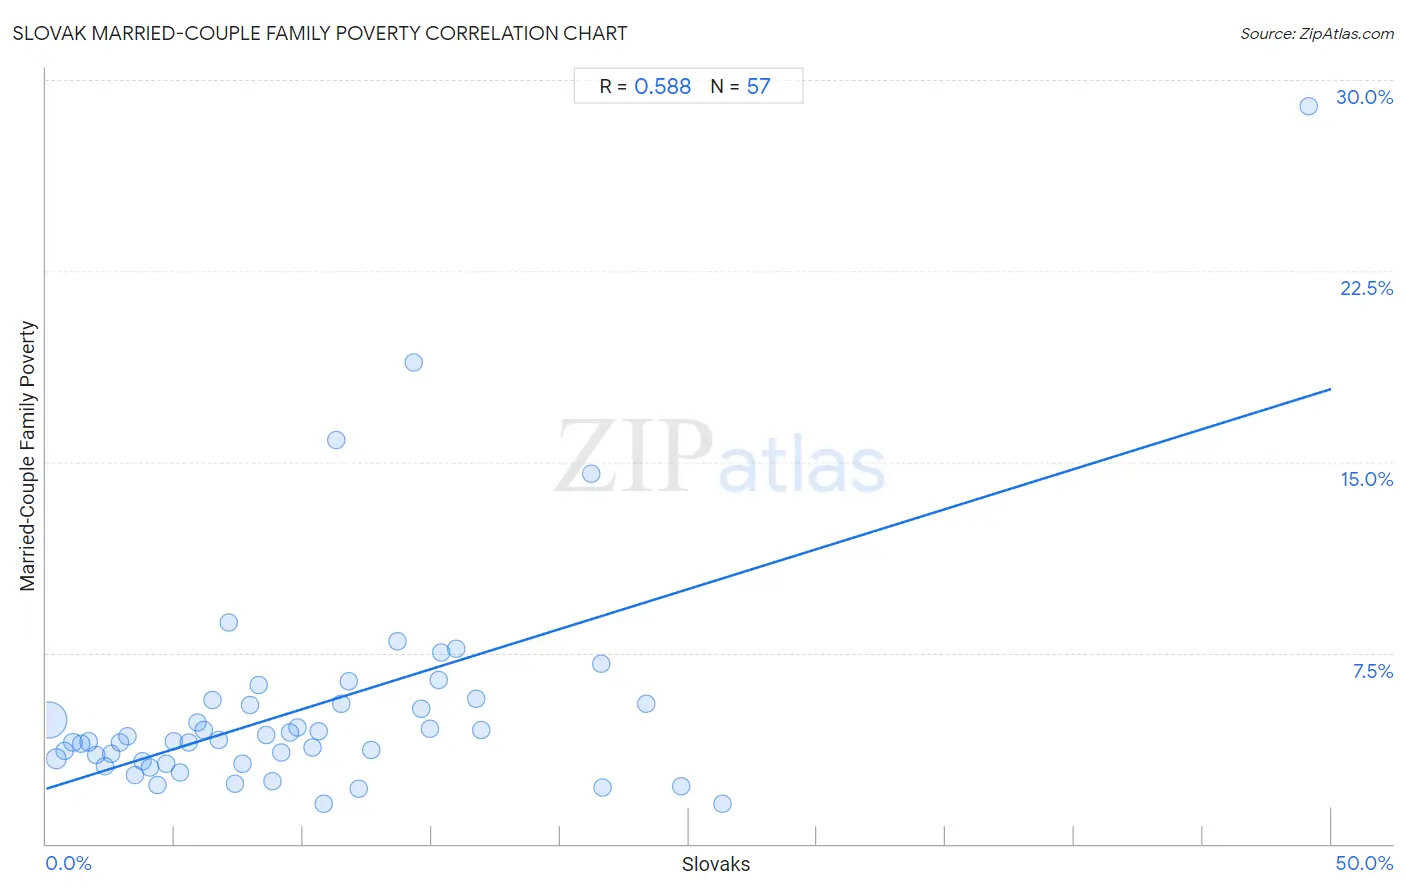
It is essential to understand that the correlation between the percentage of Slovaks and poverty level among married-couple families does not imply a direct cause-and-effect relationship. It remains uncertain whether the presence of Slovaks influences an upward or downward trend in the level of poverty level among married-couple families within an area, or if Slovaks simply ended up residing in those areas with higher or lower levels of poverty level among married-couple families due to other factors.

Demographics Similar to Slovaks by Married-Couple Family Poverty

In terms of married-couple family poverty, the demographic groups most similar to Slovaks are Polish (4.0%, a difference of 0.030%), Czech (4.0%, a difference of 0.040%), German (4.0%, a difference of 0.30%), Filipino (4.0%, a difference of 0.33%), and Italian (4.0%, a difference of 0.34%).
DemographicsRating | RankMarried-Couple Family Poverty
Latvians
100.0
/100
|
#7
Exceptional
3.9%
Thais
100.0
/100
|
#8
Exceptional
3.9%
Croatians
100.0
/100
|
#9
Exceptional
3.9%
Carpatho Rusyns
100.0
/100
|
#10
Exceptional
3.9%
Lithuanians
100.0
/100
|
#11
Exceptional
4.0%
Bulgarians
100.0
/100
|
#12
Exceptional
4.0%
Czechs
100.0
/100
|
#13
Exceptional
4.0%
Slovaks
100.0
/100
|
#14
Exceptional
4.0%
Poles
100.0
/100
|
#15
Exceptional
4.0%
Germans
100.0
/100
|
#16
Exceptional
4.0%
Filipinos
100.0
/100
|
#17
Exceptional
4.0%
Italians
100.0
/100
|
#18
Exceptional
4.0%
Immigrants from Ireland
99.9
/100
|
#19
Exceptional
4.1%
Maltese
99.9
/100
|
#20
Exceptional
4.1%
Zimbabweans
99.9
/100
|
#21
Exceptional
4.1%

Slovak Married-Couple Family Poverty Correlation Summary

MeasurementSlovak DataMarried-Couple Family Poverty Data
Minimum0.10%1.6%
Maximum49.1%28.9%
Range49.0%27.4%
Mean10.2%5.4%
Median8.5%4.1%
Interquartile 25% (IQ1)4.2%3.2%
Interquartile 75% (IQ3)14.4%5.6%
Interquartile Range (IQR)10.2%2.4%
Standard Deviation (Sample)8.4%4.5%
Standard Deviation (Population)8.4%4.5%

Correlation Details

Slovak PercentileSample SizeMarried-Couple Family Poverty
[
0.0%
-
0.5%
]
0.10%
320,321,8844.9%
[
0.0%
-
0.5%
]
0.41%
41,103,0843.3%
[
0.5%
-
1.0%
]
0.72%
11,936,2993.6%
[
1.0%
-
1.5%
]
1.03%
5,305,1024.0%
[
1.0%
-
1.5%
]
1.34%
2,984,2193.9%
[
1.5%
-
2.0%
]
1.66%
2,190,0544.0%
[
1.5%
-
2.0%
]
1.94%
1,457,5443.5%
[
2.0%
-
2.5%
]
2.27%
1,531,8063.1%
[
2.5%
-
3.0%
]
2.54%
813,3993.5%
[
2.5%
-
3.0%
]
2.85%
855,5614.0%
[
3.0%
-
3.5%
]
3.15%
651,0184.2%
[
3.0%
-
3.5%
]
3.43%
689,7662.7%
[
3.5%
-
4.0%
]
3.75%
444,6403.2%
[
4.0%
-
4.5%
]
4.06%
440,1273.0%
[
4.0%
-
4.5%
]
4.34%
312,5042.3%
[
4.5%
-
5.0%
]
4.66%
196,7723.1%
[
4.5%
-
5.0%
]
4.97%
241,1934.0%
[
5.0%
-
5.5%
]
5.20%
186,2532.8%
[
5.5%
-
6.0%
]
5.55%
98,3844.0%
[
5.5%
-
6.0%
]
5.87%
207,5464.8%
[
6.0%
-
6.5%
]
6.14%
106,6934.5%
[
6.0%
-
6.5%
]
6.47%
95,5395.7%
[
6.5%
-
7.0%
]
6.70%
145,8454.1%
[
7.0%
-
7.5%
]
7.10%
20,8028.7%
[
7.0%
-
7.5%
]
7.35%
32,5622.3%
[
7.5%
-
8.0%
]
7.65%
78,2693.2%
[
7.5%
-
8.0%
]
7.92%
27,6845.5%
[
8.0%
-
8.5%
]
8.29%
66,4076.2%
[
8.5%
-
9.0%
]
8.54%
51,4574.3%
[
8.5%
-
9.0%
]
8.80%
25,6052.5%
[
9.0%
-
9.5%
]
9.13%
12,4713.6%
[
9.0%
-
9.5%
]
9.47%
9,4734.4%
[
9.5%
-
10.0%
]
9.77%
36,8834.6%
[
10.0%
-
10.5%
]
10.38%
3,1423.8%
[
10.5%
-
11.0%
]
10.62%
15,2504.4%
[
10.5%
-
11.0%
]
10.80%
5741.6%
[
11.0%
-
11.5%
]
11.28%
1,13515.9%
[
11.0%
-
11.5%
]
11.46%
38,7265.5%
[
11.5%
-
12.0%
]
11.76%
1,3436.4%
[
12.0%
-
12.5%
]
12.18%
1,2322.1%
[
12.5%
-
13.0%
]
12.66%
4,8203.7%
[
13.5%
-
14.0%
]
13.65%
9167.9%
[
14.0%
-
14.5%
]
14.29%
33618.9%
[
14.5%
-
15.0%
]
14.58%
1,7155.3%
[
14.5%
-
15.0%
]
14.95%
2,8504.5%
[
15.0%
-
15.5%
]
15.29%
5696.5%
[
15.0%
-
15.5%
]
15.38%
1,5477.5%
[
15.5%
-
16.0%
]
15.96%
6397.6%
[
16.5%
-
17.0%
]
16.72%
9995.7%
[
16.5%
-
17.0%
]
16.94%
3,3484.5%
[
21.0%
-
21.5%
]
21.19%
84014.5%
[
21.5%
-
22.0%
]
21.58%
5057.1%
[
21.5%
-
22.0%
]
21.62%
8512.2%
[
23.0%
-
23.5%
]
23.35%
1,7305.5%
[
24.5%
-
25.0%
]
24.71%
3482.3%
[
26.0%
-
26.5%
]
26.32%
1,3451.6%
[
49.0%
-
49.5%
]
49.11%
11228.9%