Mongolian 4 or more Vehicles in Household

COMPARE

Mongolian
Race
Ancestry
AfghanAfricanAlaska NativeAlaskan AthabascanAlbanianAleutAlsatianAmericanApacheArabArapahoArgentineanArmenianAssyrian/Chaldean/SyriacAustralianAustrianBahamianBangladeshiBarbadianBasqueBelgianBelizeanBermudanBhutaneseBlackfeetBolivianBrazilianBritishBritish West IndianBulgarianBurmeseCajunCambodianCanadianCape VerdeanCarpatho RusynCelticCentral AmericanCentral American IndianCherokeeCheyenneChickasawChileanChineseChippewaChoctawColombianColvilleComancheCosta RicanCreeCreekCroatianCrowCubanCypriotCzechCzechoslovakianDanishDelawareDominicanDutchDutch West IndianEastern EuropeanEcuadorianEgyptianEnglishEstonianEthiopianEuropeanFijianFilipinoFinnishFrenchFrench American IndianFrench CanadianGermanGerman RussianGhanaianGreekGuamanian/ChamorroGuatemalanGuyaneseHaitianHmongHonduranHopiHoumaHungarianIcelanderIndian (Asian)IndonesianInupiatIranianIraqiIrishIroquoisIsraeliItalianJamaicanJapaneseJordanianKenyanKiowaKoreanLaotianLatvianLebaneseLiberianLithuanianLumbeeLuxembourgerMacedonianMalaysianMalteseMarshalleseMenomineeMexicanMexican American IndianMongolianMoroccanNative HawaiianNavajoNepaleseNew ZealanderNicaraguanNigerianNorthern EuropeanNorwegianOkinawanOsageOttawaPaiutePakistaniPalestinianPanamanianParaguayanPennsylvania GermanPeruvianPimaPolishPortuguesePotawatomiPuebloPuerto RicanPuget Sound SalishRomanianRussianSalvadoranSamoanScandinavianScotch-IrishScottishSeminoleSenegaleseSerbianShoshoneSierra LeoneanSiouxSlavicSlovakSloveneSomaliSouth AfricanSouth AmericanSouth American IndianSoviet UnionSpaniardSpanishSpanish AmericanSpanish American IndianSri LankanSubsaharan AfricanSudaneseSwedishSwissSyrianTaiwaneseThaiTlingit-HaidaTohono O'OdhamTonganTrinidadian and TobagonianTsimshianTurkishU.S. Virgin IslanderUgandanUkrainianUruguayanUteVenezuelanVietnameseWelshWest IndianYakamaYaquiYugoslavianYumanYup'ikZimbabwean
Immigration
NonimmigrantsImmigrantsAfghanistanAfricaAlbaniaArgentinaArmeniaAsiaAustraliaAustriaBahamasBangladeshBarbadosBelarusBelgiumBelizeBoliviaBosnia and HerzegovinaBrazilBulgariaBurma/MyanmarCabo VerdeCambodiaCameroonCanadaCaribbeanCentral AmericaChileChinaColombiaCongoCosta RicaCroatiaCubaCzechoslovakiaDenmarkDominicaDominican RepublicEastern AfricaEastern AsiaEastern EuropeEcuadorEgyptEl SalvadorEnglandEritreaEthiopiaEuropeFijiFranceGermanyGhanaGreeceGrenadaGuatemalaGuyanaHaitiHondurasHong KongHungaryIndiaIndonesiaIranIraqIrelandIsraelItalyJamaicaJapanJordanKazakhstanKenyaKoreaKuwaitLaosLatin AmericaLatviaLebanonLiberiaLithuaniaMalaysiaMexicoMicronesiaMiddle AfricaMoldovaMoroccoNepalNetherlandsNicaraguaNigeriaNorth AmericaNorth MacedoniaNorthern AfricaNorthern EuropeNorwayOceaniaPakistanPanamaPeruPhilippinesPolandPortugalRomaniaRussiaSaudi ArabiaScotlandSenegalSerbiaSierra LeoneSingaporeSomaliaSouth AfricaSouth AmericaSouth Central AsiaSouth Eastern AsiaSouthern EuropeSpainSri LankaSt. Vincent and the GrenadinesSudanSwedenSwitzerlandSyriaTaiwanThailandTrinidad and TobagoTurkeyUgandaUkraineUruguayUzbekistanVenezuelaVietnamWest IndiesWestern AfricaWestern AsiaWestern EuropeYemenZaireZimbabweAzores
Select to Compare
Race
Ancestry
AfghanAfricanAlaska NativeAlaskan AthabascanAlbanianAleutAlsatianAmericanApacheArabArapahoArgentineanArmenianAssyrian/Chaldean/SyriacAustralianAustrianBahamianBangladeshiBarbadianBasqueBelgianBelizeanBermudanBhutaneseBlackfeetBolivianBrazilianBritishBritish West IndianBulgarianBurmeseCajunCambodianCanadianCape VerdeanCarpatho RusynCelticCentral AmericanCentral American IndianCherokeeCheyenneChickasawChileanChineseChippewaChoctawColombianColvilleComancheCosta RicanCreeCreekCroatianCrowCubanCypriotCzechCzechoslovakianDanishDelawareDominicanDutchDutch West IndianEastern EuropeanEcuadorianEgyptianEnglishEstonianEthiopianEuropeanFijianFilipinoFinnishFrenchFrench American IndianFrench CanadianGermanGerman RussianGhanaianGreekGuamanian/ChamorroGuatemalanGuyaneseHaitianHmongHonduranHopiHoumaHungarianIcelanderIndian (Asian)IndonesianInupiatIranianIraqiIrishIroquoisIsraeliItalianJamaicanJapaneseJordanianKenyanKiowaKoreanLaotianLatvianLebaneseLiberianLithuanianLumbeeLuxembourgerMacedonianMalaysianMalteseMarshalleseMenomineeMexicanMexican American IndianMoroccanNative HawaiianNavajoNepaleseNew ZealanderNicaraguanNigerianNorthern EuropeanNorwegianOkinawanOsageOttawaPaiutePakistaniPalestinianPanamanianParaguayanPennsylvania GermanPeruvianPimaPolishPortuguesePotawatomiPuebloPuerto RicanPuget Sound SalishRomanianRussianSalvadoranSamoanScandinavianScotch-IrishScottishSeminoleSenegaleseSerbianShoshoneSierra LeoneanSiouxSlavicSlovakSloveneSomaliSouth AfricanSouth AmericanSouth American IndianSoviet UnionSpaniardSpanishSpanish AmericanSpanish American IndianSri LankanSubsaharan AfricanSudaneseSwedishSwissSyrianTaiwaneseThaiTlingit-HaidaTohono O'OdhamTonganTrinidadian and TobagonianTsimshianTurkishU.S. Virgin IslanderUgandanUkrainianUruguayanUteVenezuelanVietnameseWelshWest IndianYakamaYaquiYugoslavianYumanYup'ikZimbabwean
Immigration
NonimmigrantsImmigrantsAfghanistanAfricaAlbaniaArgentinaArmeniaAsiaAustraliaAustriaBahamasBangladeshBarbadosBelarusBelgiumBelizeBoliviaBosnia and HerzegovinaBrazilBulgariaBurma/MyanmarCabo VerdeCambodiaCameroonCanadaCaribbeanCentral AmericaChileChinaColombiaCongoCosta RicaCroatiaCubaCzechoslovakiaDenmarkDominicaDominican RepublicEastern AfricaEastern AsiaEastern EuropeEcuadorEgyptEl SalvadorEnglandEritreaEthiopiaEuropeFijiFranceGermanyGhanaGreeceGrenadaGuatemalaGuyanaHaitiHondurasHong KongHungaryIndiaIndonesiaIranIraqIrelandIsraelItalyJamaicaJapanJordanKazakhstanKenyaKoreaKuwaitLaosLatin AmericaLatviaLebanonLiberiaLithuaniaMalaysiaMexicoMicronesiaMiddle AfricaMoldovaMoroccoNepalNetherlandsNicaraguaNigeriaNorth AmericaNorth MacedoniaNorthern AfricaNorthern EuropeNorwayOceaniaPakistanPanamaPeruPhilippinesPolandPortugalRomaniaRussiaSaudi ArabiaScotlandSenegalSerbiaSierra LeoneSingaporeSomaliaSouth AfricaSouth AmericaSouth Central AsiaSouth Eastern AsiaSouthern EuropeSpainSri LankaSt. Vincent and the GrenadinesSudanSwedenSwitzerlandSyriaTaiwanThailandTrinidad and TobagoTurkeyUgandaUkraineUruguayUzbekistanVenezuelaVietnamWest IndiesWestern AfricaWestern AsiaWestern EuropeYemenZaireZimbabweAzores
4 or more Vehicles in Household
Income
Poverty
Unemployment
Labor Participation
Family Structure
Vehicle Availability
Education Level
Disability

Mongolian 4 or more Vehicles in Household
Tragic

5.8%
4+ VEHICLES AVAILABLE
3.7/ 100
METRIC RATING
241st/ 347
METRIC RANK

Mongolian 4 or more Vehicles in Household Correlation Chart

The statistical analysis conducted on geographies consisting of 139,675,009 people shows a mild positive correlation between the proportion of Mongolians and percentage of households with 4 or more vehicles available in the United States with a correlation coefficient (R) of 0.384 and weighted average of 5.8%. On average, for every 1% (one percent) increase in Mongolians within a typical geography, there is an increase of 1.7% in percentage of households with 4 or more vehicles available.
Mongolian 4 or more Vehicles in Household
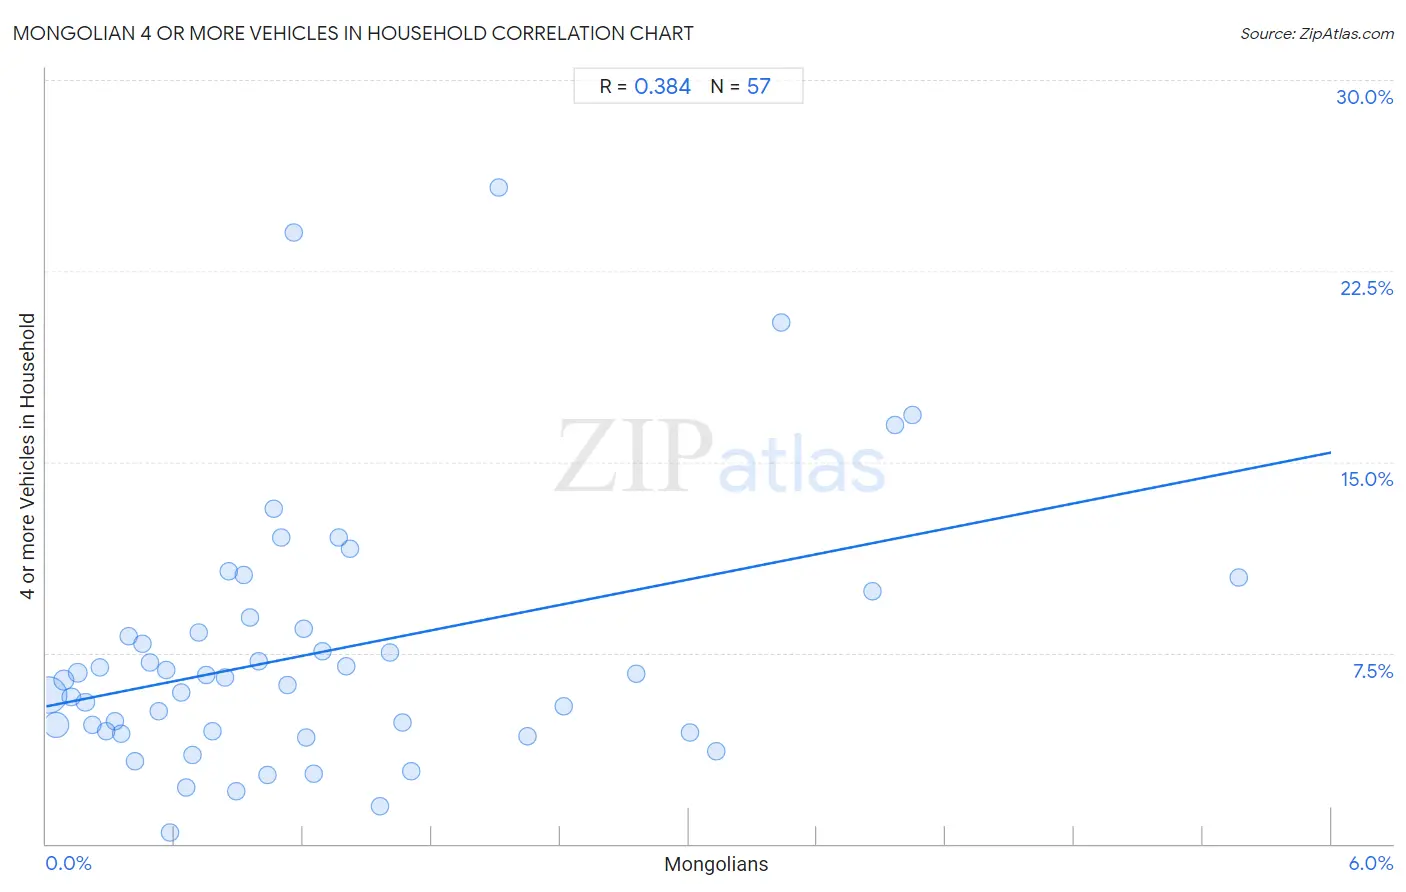
It is essential to understand that the correlation between the percentage of Mongolians and percentage of households with 4 or more vehicles available does not imply a direct cause-and-effect relationship. It remains uncertain whether the presence of Mongolians influences an upward or downward trend in the level of percentage of households with 4 or more vehicles available within an area, or if Mongolians simply ended up residing in those areas with higher or lower levels of percentage of households with 4 or more vehicles available due to other factors.

Demographics Similar to Mongolians by 4 or more Vehicles in Household

In terms of 4 or more vehicles in household, the demographic groups most similar to Mongolians are Immigrants from Poland (5.8%, a difference of 0.090%), Immigrants from Australia (5.8%, a difference of 0.14%), Immigrants from Middle Africa (5.8%, a difference of 0.21%), Immigrants from Belgium (5.8%, a difference of 0.23%), and Turkish (5.8%, a difference of 0.35%).
DemographicsRating | Rank4 or more Vehicles in Household
Africans
4.6
/100
|
#234
Tragic
5.8%
Immigrants from Hungary
4.6
/100
|
#235
Tragic
5.8%
Immigrants from Eritrea
4.5
/100
|
#236
Tragic
5.8%
Turks
4.1
/100
|
#237
Tragic
5.8%
Immigrants from Belgium
4.0
/100
|
#238
Tragic
5.8%
Immigrants from Australia
3.8
/100
|
#239
Tragic
5.8%
Immigrants from Poland
3.8
/100
|
#240
Tragic
5.8%
Mongolians
3.7
/100
|
#241
Tragic
5.8%
Immigrants from Middle Africa
3.4
/100
|
#242
Tragic
5.8%
Immigrants from Czechoslovakia
3.2
/100
|
#243
Tragic
5.8%
Ethiopians
3.2
/100
|
#244
Tragic
5.8%
Bulgarians
3.1
/100
|
#245
Tragic
5.8%
Immigrants from North Macedonia
2.5
/100
|
#246
Tragic
5.7%
Immigrants from Ethiopia
2.4
/100
|
#247
Tragic
5.7%
Immigrants from Eastern Africa
2.4
/100
|
#248
Tragic
5.7%

Mongolian 4 or more Vehicles in Household Correlation Summary

MeasurementMongolian Data4 or more Vehicles in Household Data
Minimum0.014%0.45%
Maximum5.6%25.8%
Range5.6%25.3%
Mean1.3%7.5%
Median0.95%6.5%
Interquartile 25% (IQ1)0.47%4.4%
Interquartile 75% (IQ3)1.6%8.7%
Interquartile Range (IQR)1.1%4.3%
Standard Deviation (Sample)1.2%5.1%
Standard Deviation (Population)1.2%5.0%

Correlation Details

Mongolian PercentileSample Size4 or more Vehicles in Household
[
0.0%
-
0.5%
]
0.014%
80,894,7605.9%
[
0.0%
-
0.5%
]
0.047%
32,720,4814.7%
[
0.0%
-
0.5%
]
0.081%
10,090,5616.4%
[
0.0%
-
0.5%
]
0.12%
5,202,1345.8%
[
0.0%
-
0.5%
]
0.15%
3,430,2106.7%
[
0.0%
-
0.5%
]
0.18%
2,014,2145.6%
[
0.0%
-
0.5%
]
0.21%
1,182,3904.7%
[
0.0%
-
0.5%
]
0.25%
836,5236.9%
[
0.0%
-
0.5%
]
0.28%
640,0564.4%
[
0.0%
-
0.5%
]
0.32%
420,7634.8%
[
0.0%
-
0.5%
]
0.35%
395,7614.3%
[
0.0%
-
0.5%
]
0.39%
502,1028.2%
[
0.0%
-
0.5%
]
0.41%
209,7973.3%
[
0.0%
-
0.5%
]
0.45%
190,4987.8%
[
0.0%
-
0.5%
]
0.48%
198,3527.1%
[
0.5%
-
1.0%
]
0.53%
96,5175.2%
[
0.5%
-
1.0%
]
0.56%
16,6326.8%
[
0.5%
-
1.0%
]
0.58%
2,0850.45%
[
0.5%
-
1.0%
]
0.63%
54,2465.9%
[
0.5%
-
1.0%
]
0.65%
27,8572.2%
[
0.5%
-
1.0%
]
0.68%
101,3593.5%
[
0.5%
-
1.0%
]
0.71%
4,7718.3%
[
0.5%
-
1.0%
]
0.75%
34,6266.6%
[
0.5%
-
1.0%
]
0.78%
9024.4%
[
0.5%
-
1.0%
]
0.83%
28,3576.5%
[
0.5%
-
1.0%
]
0.85%
18,74510.7%
[
0.5%
-
1.0%
]
0.89%
35,1722.1%
[
0.5%
-
1.0%
]
0.92%
35,23810.5%
[
0.5%
-
1.0%
]
0.95%
33,5448.9%
[
0.5%
-
1.0%
]
0.99%
16,7207.2%
[
1.0%
-
1.5%
]
1.03%
20,7592.7%
[
1.0%
-
1.5%
]
1.06%
3,57913.1%
[
1.0%
-
1.5%
]
1.10%
63812.0%
[
1.0%
-
1.5%
]
1.12%
27,8436.2%
[
1.0%
-
1.5%
]
1.16%
69224.0%
[
1.0%
-
1.5%
]
1.20%
5,7428.5%
[
1.0%
-
1.5%
]
1.21%
20,0434.2%
[
1.0%
-
1.5%
]
1.25%
19,1822.8%
[
1.0%
-
1.5%
]
1.29%
42,6517.5%
[
1.0%
-
1.5%
]
1.36%
80612.0%
[
1.0%
-
1.5%
]
1.40%
5007.0%
[
1.0%
-
1.5%
]
1.42%
25,11711.6%
[
1.5%
-
2.0%
]
1.56%
22,0431.5%
[
1.5%
-
2.0%
]
1.60%
5,2997.5%
[
1.5%
-
2.0%
]
1.66%
2,7664.8%
[
1.5%
-
2.0%
]
1.70%
5,9282.8%
[
2.0%
-
2.5%
]
2.11%
1,70325.8%
[
2.0%
-
2.5%
]
2.25%
9,5124.2%
[
2.0%
-
2.5%
]
2.41%
1,5745.4%
[
2.5%
-
3.0%
]
2.75%
5456.7%
[
3.0%
-
3.5%
]
3.01%
1,1644.4%
[
3.0%
-
3.5%
]
3.13%
1,6933.7%
[
3.0%
-
3.5%
]
3.43%
12,38720.5%
[
3.5%
-
4.0%
]
3.86%
3,4489.9%
[
3.5%
-
4.0%
]
3.97%
1,03416.5%
[
4.0%
-
4.5%
]
4.05%
1,01316.8%
[
5.5%
-
6.0%
]
5.57%
1,97510.4%