Mongolian College, Under 1 year
COMPARE
Mongolian
Select to Compare
College, Under 1 year
Mongolian College, Under 1 year
69.9%
COLLEGE, UNDER 1 YEAR
99.8/ 100
METRIC RATING
51st/ 347
METRIC RANK
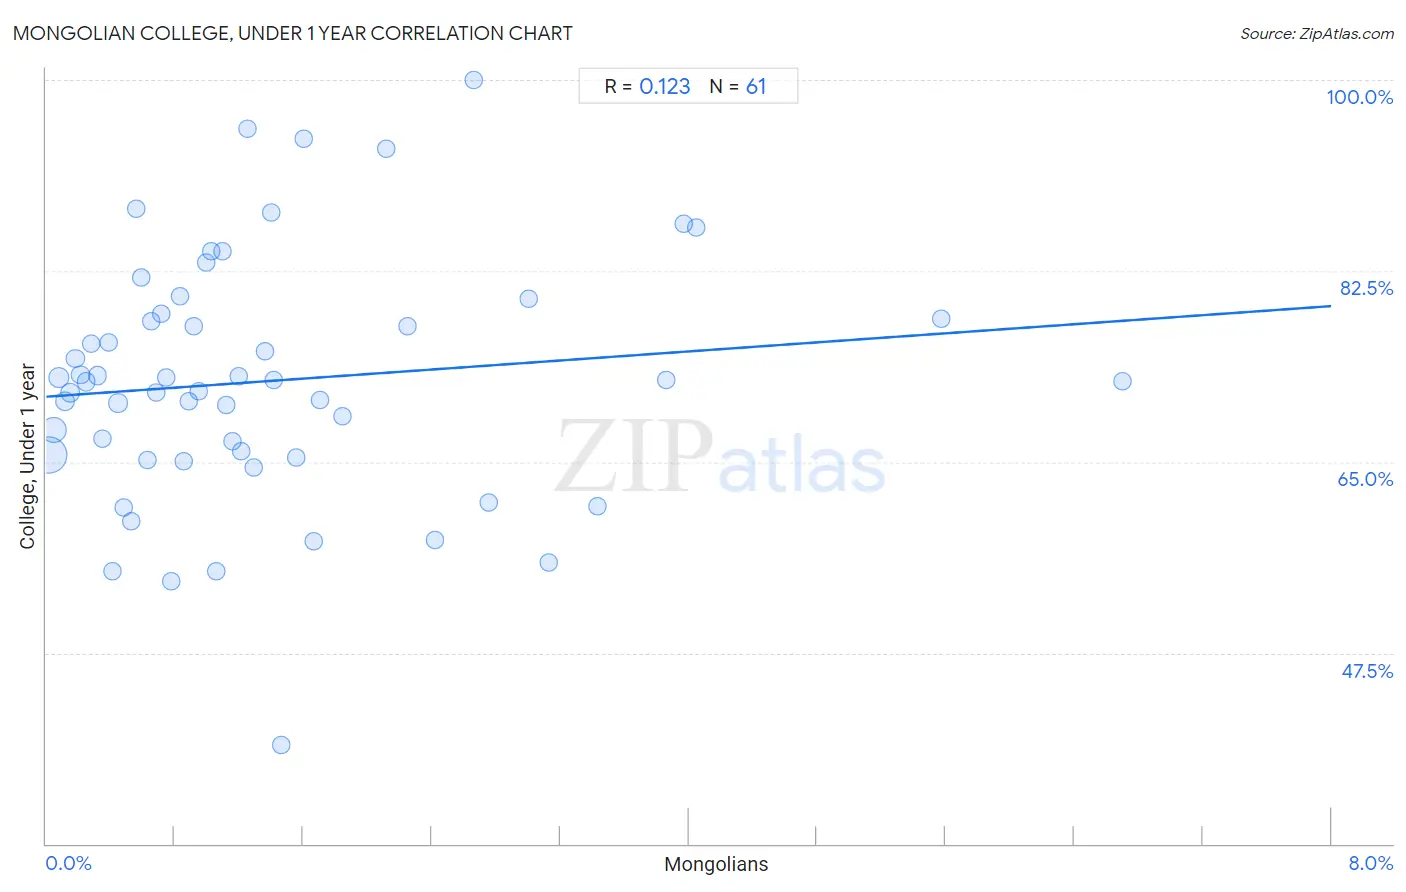
Mongolian College, Under 1 year Correlation Chart
The statistical analysis conducted on geographies consisting of 140,362,004 people shows a poor positive correlation between the proportion of Mongolians and percentage of population with at least college, under 1 year education in the United States with a correlation coefficient (R) of 0.123 and weighted average of 69.9%. On average, for every 1% (one percent) increase in Mongolians within a typical geography, there is an increase of 1.0% in percentage of population with at least college, under 1 year education.
It is essential to understand that the correlation between the percentage of Mongolians and percentage of population with at least college, under 1 year education does not imply a direct cause-and-effect relationship. It remains uncertain whether the presence of Mongolians influences an upward or downward trend in the level of percentage of population with at least college, under 1 year education within an area, or if Mongolians simply ended up residing in those areas with higher or lower levels of percentage of population with at least college, under 1 year education due to other factors.
Demographics Similar to Mongolians by College, Under 1 year
In terms of college, under 1 year, the demographic groups most similar to Mongolians are Immigrants from Russia (69.9%, a difference of 0.020%), Zimbabwean (69.9%, a difference of 0.040%), Immigrants from Austria (70.0%, a difference of 0.15%), Immigrants from Netherlands (70.0%, a difference of 0.20%), and Immigrants from Bulgaria (70.0%, a difference of 0.25%).
| Demographics | Rating | Rank | College, Under 1 year |
| New Zealanders | 99.9 /100 | #44 | Exceptional 70.2% |
| Immigrants from Norway | 99.9 /100 | #45 | Exceptional 70.2% |
| Immigrants from Latvia | 99.9 /100 | #46 | Exceptional 70.1% |
| Immigrants from Bulgaria | 99.8 /100 | #47 | Exceptional 70.0% |
| Immigrants from Netherlands | 99.8 /100 | #48 | Exceptional 70.0% |
| Immigrants from Austria | 99.8 /100 | #49 | Exceptional 70.0% |
| Zimbabweans | 99.8 /100 | #50 | Exceptional 69.9% |
| Mongolians | 99.8 /100 | #51 | Exceptional 69.9% |
| Immigrants from Russia | 99.8 /100 | #52 | Exceptional 69.9% |
| South Africans | 99.7 /100 | #53 | Exceptional 69.7% |
| Immigrants from Czechoslovakia | 99.7 /100 | #54 | Exceptional 69.6% |
| Maltese | 99.7 /100 | #55 | Exceptional 69.5% |
| Immigrants from Scotland | 99.6 /100 | #56 | Exceptional 69.4% |
| Asians | 99.6 /100 | #57 | Exceptional 69.4% |
| Immigrants from Malaysia | 99.6 /100 | #58 | Exceptional 69.3% |
Mongolian College, Under 1 year Correlation Summary
| Measurement | Mongolian Data | College, Under 1 year Data |
| Minimum | 0.014% | 39.1% |
| Maximum | 6.7% | 100.0% |
| Range | 6.7% | 60.9% |
| Mean | 1.4% | 72.4% |
| Median | 1.0% | 72.4% |
| Interquartile 25% (IQ1) | 0.51% | 65.5% |
| Interquartile 75% (IQ3) | 1.7% | 78.3% |
| Interquartile Range (IQR) | 1.2% | 12.8% |
| Standard Deviation (Sample) | 1.3% | 11.3% |
| Standard Deviation (Population) | 1.3% | 11.2% |
Correlation Details
| Mongolian Percentile | Sample Size | College, Under 1 year |
[ 0.0% - 0.5% ] 0.014% | 81,115,098 | 65.7% |
[ 0.0% - 0.5% ] 0.047% | 32,831,127 | 67.9% |
[ 0.0% - 0.5% ] 0.081% | 10,153,685 | 72.7% |
[ 0.0% - 0.5% ] 0.12% | 5,228,843 | 70.6% |
[ 0.0% - 0.5% ] 0.15% | 3,495,152 | 71.3% |
[ 0.0% - 0.5% ] 0.18% | 2,021,459 | 74.5% |
[ 0.0% - 0.5% ] 0.21% | 1,193,373 | 73.0% |
[ 0.0% - 0.5% ] 0.25% | 854,926 | 72.3% |
[ 0.0% - 0.5% ] 0.28% | 651,590 | 75.9% |
[ 0.0% - 0.5% ] 0.32% | 428,866 | 72.9% |
[ 0.0% - 0.5% ] 0.35% | 405,453 | 67.1% |
[ 0.0% - 0.5% ] 0.39% | 507,903 | 76.0% |
[ 0.0% - 0.5% ] 0.41% | 209,797 | 55.0% |
[ 0.0% - 0.5% ] 0.45% | 196,271 | 70.4% |
[ 0.0% - 0.5% ] 0.48% | 211,995 | 60.9% |
[ 0.5% - 1.0% ] 0.53% | 108,027 | 59.5% |
[ 0.5% - 1.0% ] 0.56% | 17,861 | 88.2% |
[ 0.5% - 1.0% ] 0.59% | 13,931 | 81.9% |
[ 0.5% - 1.0% ] 0.63% | 114,726 | 65.2% |
[ 0.5% - 1.0% ] 0.65% | 30,189 | 77.9% |
[ 0.5% - 1.0% ] 0.68% | 101,359 | 71.4% |
[ 0.5% - 1.0% ] 0.72% | 7,934 | 78.5% |
[ 0.5% - 1.0% ] 0.75% | 34,626 | 72.7% |
[ 0.5% - 1.0% ] 0.78% | 902 | 54.0% |
[ 0.5% - 1.0% ] 0.83% | 28,357 | 80.2% |
[ 0.5% - 1.0% ] 0.85% | 18,745 | 65.0% |
[ 0.5% - 1.0% ] 0.89% | 35,172 | 70.6% |
[ 0.5% - 1.0% ] 0.92% | 35,238 | 77.4% |
[ 0.5% - 1.0% ] 0.95% | 33,544 | 71.5% |
[ 0.5% - 1.0% ] 0.99% | 16,720 | 83.3% |
[ 1.0% - 1.5% ] 1.03% | 20,759 | 84.3% |
[ 1.0% - 1.5% ] 1.06% | 3,579 | 55.0% |
[ 1.0% - 1.5% ] 1.10% | 638 | 84.3% |
[ 1.0% - 1.5% ] 1.12% | 34,201 | 70.3% |
[ 1.0% - 1.5% ] 1.16% | 692 | 66.9% |
[ 1.0% - 1.5% ] 1.20% | 5,742 | 72.8% |
[ 1.0% - 1.5% ] 1.21% | 21,113 | 66.0% |
[ 1.0% - 1.5% ] 1.25% | 19,182 | 95.5% |
[ 1.0% - 1.5% ] 1.29% | 46,966 | 64.5% |
[ 1.0% - 1.5% ] 1.36% | 806 | 75.1% |
[ 1.0% - 1.5% ] 1.40% | 500 | 87.9% |
[ 1.0% - 1.5% ] 1.42% | 25,117 | 72.5% |
[ 1.0% - 1.5% ] 1.47% | 341 | 39.1% |
[ 1.5% - 2.0% ] 1.56% | 22,043 | 65.4% |
[ 1.5% - 2.0% ] 1.60% | 5,299 | 94.6% |
[ 1.5% - 2.0% ] 1.66% | 2,766 | 57.7% |
[ 1.5% - 2.0% ] 1.70% | 5,928 | 70.7% |
[ 1.5% - 2.0% ] 1.84% | 1,573 | 69.2% |
[ 2.0% - 2.5% ] 2.11% | 1,703 | 93.7% |
[ 2.0% - 2.5% ] 2.25% | 9,512 | 77.4% |
[ 2.0% - 2.5% ] 2.42% | 2,605 | 57.8% |
[ 2.5% - 3.0% ] 2.66% | 2,632 | 100.0% |
[ 2.5% - 3.0% ] 2.75% | 545 | 61.3% |
[ 3.0% - 3.5% ] 3.01% | 1,164 | 79.9% |
[ 3.0% - 3.5% ] 3.13% | 1,693 | 55.8% |
[ 3.0% - 3.5% ] 3.43% | 12,387 | 60.9% |
[ 3.5% - 4.0% ] 3.86% | 4,120 | 72.5% |
[ 3.5% - 4.0% ] 3.97% | 1,034 | 86.8% |
[ 4.0% - 4.5% ] 4.05% | 1,013 | 86.5% |
[ 5.5% - 6.0% ] 5.57% | 1,975 | 78.1% |
[ 6.5% - 7.0% ] 6.70% | 1,507 | 72.4% |