Mongolian Self-Care Disability
COMPARE
Mongolian
Select to Compare
Self-Care Disability
Mongolian Self-Care Disability
2.3%
SELF-CARE DISABILITY
99.3/ 100
METRIC RATING
63rd/ 347
METRIC RANK
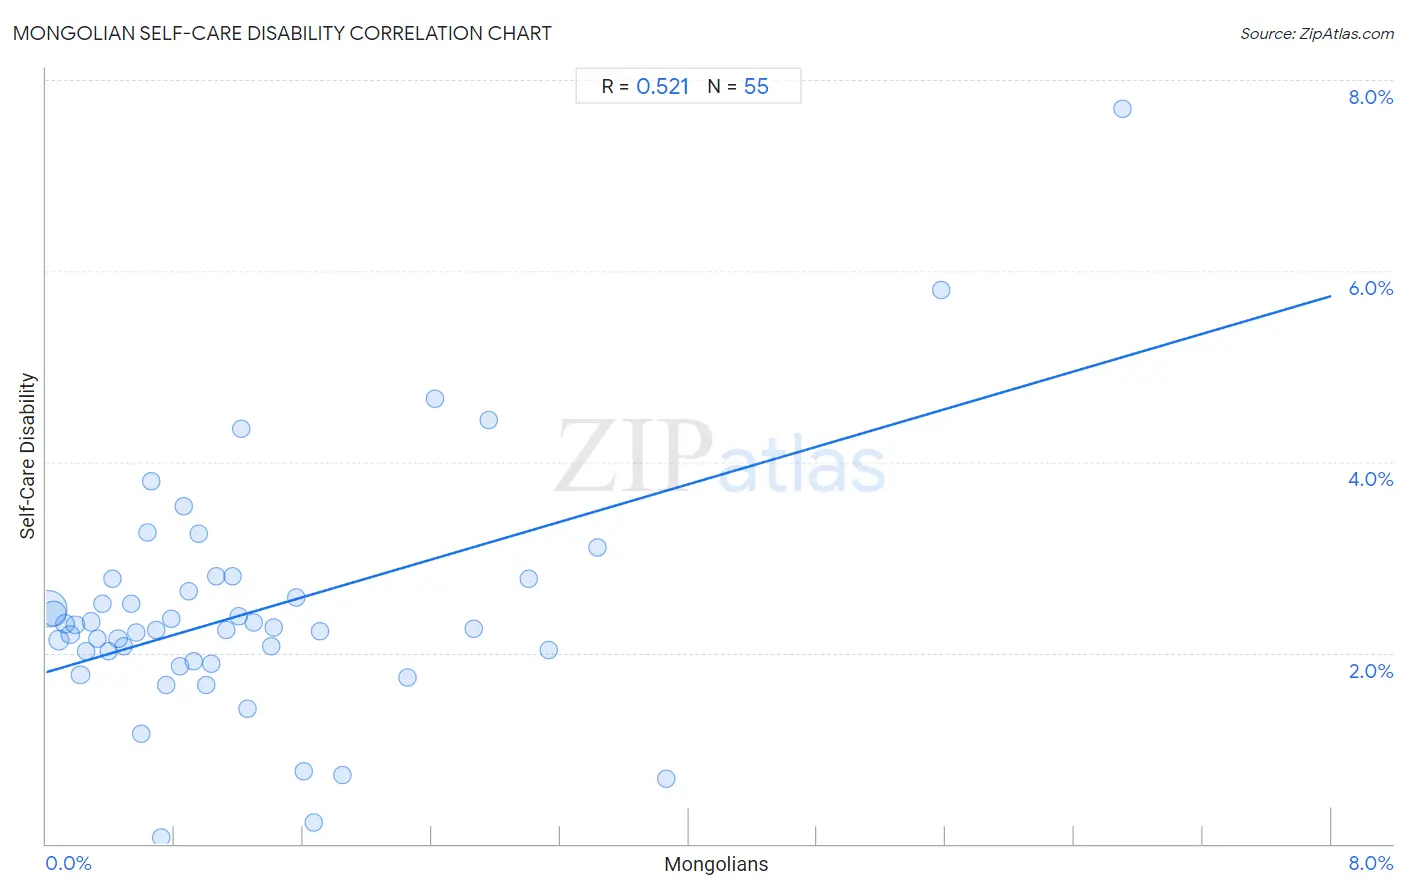
Mongolian Self-Care Disability Correlation Chart
The statistical analysis conducted on geographies consisting of 140,258,079 people shows a substantial positive correlation between the proportion of Mongolians and percentage of population with self-care disability in the United States with a correlation coefficient (R) of 0.521 and weighted average of 2.3%. On average, for every 1% (one percent) increase in Mongolians within a typical geography, there is an increase of 0.49% in percentage of population with self-care disability.
It is essential to understand that the correlation between the percentage of Mongolians and percentage of population with self-care disability does not imply a direct cause-and-effect relationship. It remains uncertain whether the presence of Mongolians influences an upward or downward trend in the level of percentage of population with self-care disability within an area, or if Mongolians simply ended up residing in those areas with higher or lower levels of percentage of population with self-care disability due to other factors.
Demographics Similar to Mongolians by Self-Care Disability
In terms of self-care disability, the demographic groups most similar to Mongolians are Swedish (2.3%, a difference of 0.010%), Brazilian (2.3%, a difference of 0.070%), Egyptian (2.3%, a difference of 0.090%), Immigrants from Argentina (2.3%, a difference of 0.10%), and South African (2.3%, a difference of 0.13%).
| Demographics | Rating | Rank | Self-Care Disability |
| Immigrants from Eastern Asia | 99.6 /100 | #56 | Exceptional 2.3% |
| Immigrants from Belgium | 99.6 /100 | #57 | Exceptional 2.3% |
| Immigrants from Cameroon | 99.6 /100 | #58 | Exceptional 2.3% |
| New Zealanders | 99.5 /100 | #59 | Exceptional 2.3% |
| Immigrants from Japan | 99.5 /100 | #60 | Exceptional 2.3% |
| Palestinians | 99.4 /100 | #61 | Exceptional 2.3% |
| Egyptians | 99.4 /100 | #62 | Exceptional 2.3% |
| Mongolians | 99.3 /100 | #63 | Exceptional 2.3% |
| Swedes | 99.3 /100 | #64 | Exceptional 2.3% |
| Brazilians | 99.3 /100 | #65 | Exceptional 2.3% |
| Immigrants from Argentina | 99.3 /100 | #66 | Exceptional 2.3% |
| South Africans | 99.3 /100 | #67 | Exceptional 2.3% |
| Immigrants from Zaire | 99.2 /100 | #68 | Exceptional 2.3% |
| Immigrants from Norway | 99.2 /100 | #69 | Exceptional 2.3% |
| Immigrants from Northern Europe | 99.2 /100 | #70 | Exceptional 2.3% |
Mongolian Self-Care Disability Correlation Summary
| Measurement | Mongolian Data | Self-Care Disability Data |
| Minimum | 0.014% | 0.065% |
| Maximum | 6.7% | 7.7% |
| Range | 6.7% | 7.6% |
| Mean | 1.3% | 2.4% |
| Median | 0.92% | 2.2% |
| Interquartile 25% (IQ1) | 0.45% | 1.9% |
| Interquartile 75% (IQ3) | 1.6% | 2.8% |
| Interquartile Range (IQR) | 1.2% | 0.86% |
| Standard Deviation (Sample) | 1.3% | 1.2% |
| Standard Deviation (Population) | 1.3% | 1.2% |
Correlation Details
| Mongolian Percentile | Sample Size | Self-Care Disability |
[ 0.0% - 0.5% ] 0.014% | 81,115,098 | 2.5% |
[ 0.0% - 0.5% ] 0.047% | 32,818,514 | 2.4% |
[ 0.0% - 0.5% ] 0.081% | 10,153,685 | 2.1% |
[ 0.0% - 0.5% ] 0.12% | 5,214,173 | 2.3% |
[ 0.0% - 0.5% ] 0.15% | 3,495,152 | 2.2% |
[ 0.0% - 0.5% ] 0.18% | 2,014,214 | 2.3% |
[ 0.0% - 0.5% ] 0.21% | 1,193,373 | 1.8% |
[ 0.0% - 0.5% ] 0.25% | 838,622 | 2.0% |
[ 0.0% - 0.5% ] 0.28% | 640,056 | 2.3% |
[ 0.0% - 0.5% ] 0.32% | 428,866 | 2.2% |
[ 0.0% - 0.5% ] 0.35% | 397,244 | 2.5% |
[ 0.0% - 0.5% ] 0.39% | 503,425 | 2.0% |
[ 0.0% - 0.5% ] 0.41% | 209,797 | 2.8% |
[ 0.0% - 0.5% ] 0.45% | 196,271 | 2.1% |
[ 0.0% - 0.5% ] 0.48% | 202,396 | 2.1% |
[ 0.5% - 1.0% ] 0.53% | 108,027 | 2.5% |
[ 0.5% - 1.0% ] 0.56% | 16,632 | 2.2% |
[ 0.5% - 1.0% ] 0.59% | 13,931 | 1.1% |
[ 0.5% - 1.0% ] 0.63% | 112,164 | 3.3% |
[ 0.5% - 1.0% ] 0.65% | 27,857 | 3.8% |
[ 0.5% - 1.0% ] 0.68% | 101,359 | 2.2% |
[ 0.5% - 1.0% ] 0.72% | 6,677 | 0.065% |
[ 0.5% - 1.0% ] 0.75% | 34,626 | 1.7% |
[ 0.5% - 1.0% ] 0.78% | 902 | 2.4% |
[ 0.5% - 1.0% ] 0.83% | 28,357 | 1.9% |
[ 0.5% - 1.0% ] 0.85% | 18,745 | 3.5% |
[ 0.5% - 1.0% ] 0.89% | 35,172 | 2.6% |
[ 0.5% - 1.0% ] 0.92% | 35,238 | 1.9% |
[ 0.5% - 1.0% ] 0.95% | 33,544 | 3.3% |
[ 0.5% - 1.0% ] 0.99% | 16,720 | 1.7% |
[ 1.0% - 1.5% ] 1.03% | 20,759 | 1.9% |
[ 1.0% - 1.5% ] 1.06% | 3,579 | 2.8% |
[ 1.0% - 1.5% ] 1.12% | 27,843 | 2.2% |
[ 1.0% - 1.5% ] 1.16% | 692 | 2.8% |
[ 1.0% - 1.5% ] 1.20% | 5,742 | 2.4% |
[ 1.0% - 1.5% ] 1.21% | 21,113 | 4.3% |
[ 1.0% - 1.5% ] 1.25% | 19,182 | 1.4% |
[ 1.0% - 1.5% ] 1.29% | 46,966 | 2.3% |
[ 1.0% - 1.5% ] 1.40% | 500 | 2.1% |
[ 1.0% - 1.5% ] 1.42% | 25,117 | 2.3% |
[ 1.5% - 2.0% ] 1.56% | 22,043 | 2.6% |
[ 1.5% - 2.0% ] 1.60% | 5,299 | 0.76% |
[ 1.5% - 2.0% ] 1.66% | 2,766 | 0.23% |
[ 1.5% - 2.0% ] 1.70% | 5,928 | 2.2% |
[ 1.5% - 2.0% ] 1.84% | 1,573 | 0.73% |
[ 2.0% - 2.5% ] 2.25% | 9,512 | 1.7% |
[ 2.0% - 2.5% ] 2.42% | 2,605 | 4.7% |
[ 2.5% - 3.0% ] 2.66% | 2,632 | 2.2% |
[ 2.5% - 3.0% ] 2.75% | 545 | 4.4% |
[ 3.0% - 3.5% ] 3.01% | 1,164 | 2.8% |
[ 3.0% - 3.5% ] 3.13% | 1,693 | 2.0% |
[ 3.0% - 3.5% ] 3.43% | 12,387 | 3.1% |
[ 3.5% - 4.0% ] 3.86% | 4,120 | 0.68% |
[ 5.5% - 6.0% ] 5.57% | 1,975 | 5.8% |
[ 6.5% - 7.0% ] 6.70% | 1,507 | 7.7% |