Mongolian Married-Couple Family Poverty

COMPARE

Mongolian
Race
Ancestry
AfghanAfricanAlaska NativeAlaskan AthabascanAlbanianAleutAlsatianAmericanApacheArabArapahoArgentineanArmenianAssyrian/Chaldean/SyriacAustralianAustrianBahamianBangladeshiBarbadianBasqueBelgianBelizeanBermudanBhutaneseBlackfeetBolivianBrazilianBritishBritish West IndianBulgarianBurmeseCajunCambodianCanadianCape VerdeanCarpatho RusynCelticCentral AmericanCentral American IndianCherokeeCheyenneChickasawChileanChineseChippewaChoctawColombianColvilleComancheCosta RicanCreeCreekCroatianCrowCubanCypriotCzechCzechoslovakianDanishDelawareDominicanDutchDutch West IndianEastern EuropeanEcuadorianEgyptianEnglishEstonianEthiopianEuropeanFijianFilipinoFinnishFrenchFrench American IndianFrench CanadianGermanGerman RussianGhanaianGreekGuamanian/ChamorroGuatemalanGuyaneseHaitianHmongHonduranHopiHoumaHungarianIcelanderIndian (Asian)IndonesianInupiatIranianIraqiIrishIroquoisIsraeliItalianJamaicanJapaneseJordanianKenyanKiowaKoreanLaotianLatvianLebaneseLiberianLithuanianLumbeeLuxembourgerMacedonianMalaysianMalteseMarshalleseMenomineeMexicanMexican American IndianMongolianMoroccanNative HawaiianNavajoNepaleseNew ZealanderNicaraguanNigerianNorthern EuropeanNorwegianOkinawanOsageOttawaPaiutePakistaniPalestinianPanamanianParaguayanPennsylvania GermanPeruvianPimaPolishPortuguesePotawatomiPuebloPuerto RicanPuget Sound SalishRomanianRussianSalvadoranSamoanScandinavianScotch-IrishScottishSeminoleSenegaleseSerbianShoshoneSierra LeoneanSiouxSlavicSlovakSloveneSomaliSouth AfricanSouth AmericanSouth American IndianSoviet UnionSpaniardSpanishSpanish AmericanSpanish American IndianSri LankanSubsaharan AfricanSudaneseSwedishSwissSyrianTaiwaneseThaiTlingit-HaidaTohono O'OdhamTonganTrinidadian and TobagonianTsimshianTurkishU.S. Virgin IslanderUgandanUkrainianUruguayanUteVenezuelanVietnameseWelshWest IndianYakamaYaquiYugoslavianYumanYup'ikZimbabwean
Immigration
NonimmigrantsImmigrantsAfghanistanAfricaAlbaniaArgentinaArmeniaAsiaAustraliaAustriaBahamasBangladeshBarbadosBelarusBelgiumBelizeBoliviaBosnia and HerzegovinaBrazilBulgariaBurma/MyanmarCabo VerdeCambodiaCameroonCanadaCaribbeanCentral AmericaChileChinaColombiaCongoCosta RicaCroatiaCubaCzechoslovakiaDenmarkDominicaDominican RepublicEastern AfricaEastern AsiaEastern EuropeEcuadorEgyptEl SalvadorEnglandEritreaEthiopiaEuropeFijiFranceGermanyGhanaGreeceGrenadaGuatemalaGuyanaHaitiHondurasHong KongHungaryIndiaIndonesiaIranIraqIrelandIsraelItalyJamaicaJapanJordanKazakhstanKenyaKoreaKuwaitLaosLatin AmericaLatviaLebanonLiberiaLithuaniaMalaysiaMexicoMicronesiaMiddle AfricaMoldovaMoroccoNepalNetherlandsNicaraguaNigeriaNorth AmericaNorth MacedoniaNorthern AfricaNorthern EuropeNorwayOceaniaPakistanPanamaPeruPhilippinesPolandPortugalRomaniaRussiaSaudi ArabiaScotlandSenegalSerbiaSierra LeoneSingaporeSomaliaSouth AfricaSouth AmericaSouth Central AsiaSouth Eastern AsiaSouthern EuropeSpainSri LankaSt. Vincent and the GrenadinesSudanSwedenSwitzerlandSyriaTaiwanThailandTrinidad and TobagoTurkeyUgandaUkraineUruguayUzbekistanVenezuelaVietnamWest IndiesWestern AfricaWestern AsiaWestern EuropeYemenZaireZimbabweAzores
Select to Compare
Race
Ancestry
AfghanAfricanAlaska NativeAlaskan AthabascanAlbanianAleutAlsatianAmericanApacheArabArapahoArgentineanArmenianAssyrian/Chaldean/SyriacAustralianAustrianBahamianBangladeshiBarbadianBasqueBelgianBelizeanBermudanBhutaneseBlackfeetBolivianBrazilianBritishBritish West IndianBulgarianBurmeseCajunCambodianCanadianCape VerdeanCarpatho RusynCelticCentral AmericanCentral American IndianCherokeeCheyenneChickasawChileanChineseChippewaChoctawColombianColvilleComancheCosta RicanCreeCreekCroatianCrowCubanCypriotCzechCzechoslovakianDanishDelawareDominicanDutchDutch West IndianEastern EuropeanEcuadorianEgyptianEnglishEstonianEthiopianEuropeanFijianFilipinoFinnishFrenchFrench American IndianFrench CanadianGermanGerman RussianGhanaianGreekGuamanian/ChamorroGuatemalanGuyaneseHaitianHmongHonduranHopiHoumaHungarianIcelanderIndian (Asian)IndonesianInupiatIranianIraqiIrishIroquoisIsraeliItalianJamaicanJapaneseJordanianKenyanKiowaKoreanLaotianLatvianLebaneseLiberianLithuanianLumbeeLuxembourgerMacedonianMalaysianMalteseMarshalleseMenomineeMexicanMexican American IndianMoroccanNative HawaiianNavajoNepaleseNew ZealanderNicaraguanNigerianNorthern EuropeanNorwegianOkinawanOsageOttawaPaiutePakistaniPalestinianPanamanianParaguayanPennsylvania GermanPeruvianPimaPolishPortuguesePotawatomiPuebloPuerto RicanPuget Sound SalishRomanianRussianSalvadoranSamoanScandinavianScotch-IrishScottishSeminoleSenegaleseSerbianShoshoneSierra LeoneanSiouxSlavicSlovakSloveneSomaliSouth AfricanSouth AmericanSouth American IndianSoviet UnionSpaniardSpanishSpanish AmericanSpanish American IndianSri LankanSubsaharan AfricanSudaneseSwedishSwissSyrianTaiwaneseThaiTlingit-HaidaTohono O'OdhamTonganTrinidadian and TobagonianTsimshianTurkishU.S. Virgin IslanderUgandanUkrainianUruguayanUteVenezuelanVietnameseWelshWest IndianYakamaYaquiYugoslavianYumanYup'ikZimbabwean
Immigration
NonimmigrantsImmigrantsAfghanistanAfricaAlbaniaArgentinaArmeniaAsiaAustraliaAustriaBahamasBangladeshBarbadosBelarusBelgiumBelizeBoliviaBosnia and HerzegovinaBrazilBulgariaBurma/MyanmarCabo VerdeCambodiaCameroonCanadaCaribbeanCentral AmericaChileChinaColombiaCongoCosta RicaCroatiaCubaCzechoslovakiaDenmarkDominicaDominican RepublicEastern AfricaEastern AsiaEastern EuropeEcuadorEgyptEl SalvadorEnglandEritreaEthiopiaEuropeFijiFranceGermanyGhanaGreeceGrenadaGuatemalaGuyanaHaitiHondurasHong KongHungaryIndiaIndonesiaIranIraqIrelandIsraelItalyJamaicaJapanJordanKazakhstanKenyaKoreaKuwaitLaosLatin AmericaLatviaLebanonLiberiaLithuaniaMalaysiaMexicoMicronesiaMiddle AfricaMoldovaMoroccoNepalNetherlandsNicaraguaNigeriaNorth AmericaNorth MacedoniaNorthern AfricaNorthern EuropeNorwayOceaniaPakistanPanamaPeruPhilippinesPolandPortugalRomaniaRussiaSaudi ArabiaScotlandSenegalSerbiaSierra LeoneSingaporeSomaliaSouth AfricaSouth AmericaSouth Central AsiaSouth Eastern AsiaSouthern EuropeSpainSri LankaSt. Vincent and the GrenadinesSudanSwedenSwitzerlandSyriaTaiwanThailandTrinidad and TobagoTurkeyUgandaUkraineUruguayUzbekistanVenezuelaVietnamWest IndiesWestern AfricaWestern AsiaWestern EuropeYemenZaireZimbabweAzores
Married-Couple Family Poverty
Income
Poverty
Unemployment
Labor Participation
Family Structure
Vehicle Availability
Education Level
Disability

Mongolian Married-Couple Family Poverty
Good

5.0%
POVERTY | MARRIED-COUPLE FAMILIES
79.8/ 100
METRIC RATING
146th/ 347
METRIC RANK

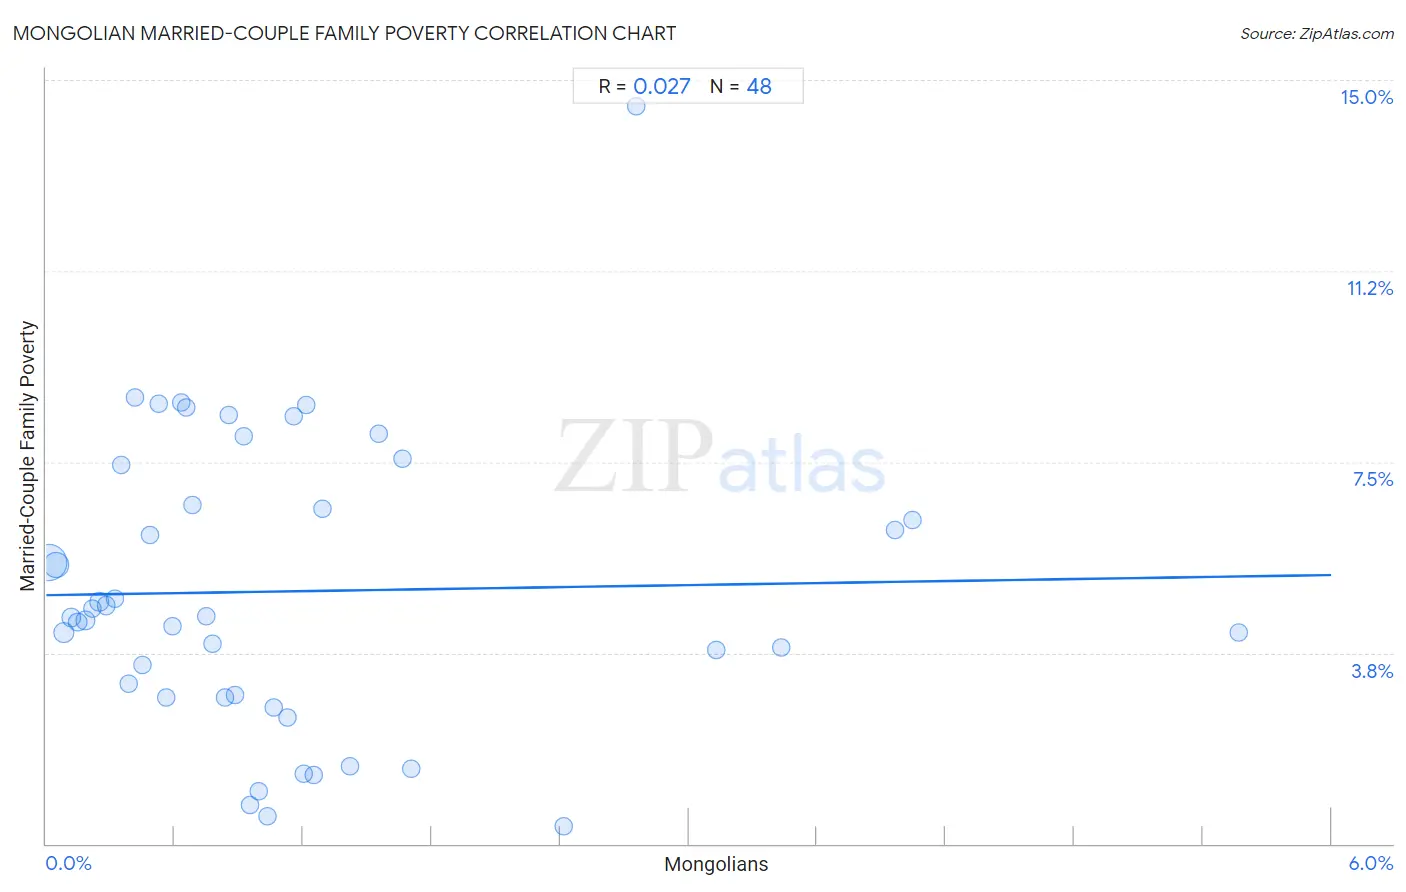
Mongolian Married-Couple Family Poverty Correlation Chart

The statistical analysis conducted on geographies consisting of 139,875,395 people shows no correlation between the proportion of Mongolians and poverty level among married-couple families in the United States with a correlation coefficient (R) of 0.027 and weighted average of 5.0%. On average, for every 1% (one percent) increase in Mongolians within a typical geography, there is an increase of 0.066% in poverty level among married-couple families.
Mongolian Married-Couple Family Poverty
It is essential to understand that the correlation between the percentage of Mongolians and poverty level among married-couple families does not imply a direct cause-and-effect relationship. It remains uncertain whether the presence of Mongolians influences an upward or downward trend in the level of poverty level among married-couple families within an area, or if Mongolians simply ended up residing in those areas with higher or lower levels of poverty level among married-couple families due to other factors.

Demographics Similar to Mongolians by Married-Couple Family Poverty

In terms of married-couple family poverty, the demographic groups most similar to Mongolians are Immigrants from Spain (5.0%, a difference of 0.020%), Syrian (5.0%, a difference of 0.19%), Immigrants from Russia (5.0%, a difference of 0.20%), Immigrants from Oceania (5.0%, a difference of 0.22%), and Brazilian (5.0%, a difference of 0.27%).
DemographicsRating | RankMarried-Couple Family Poverty
German Russians
85.1
/100
|
#139
Excellent
5.0%
Immigrants from Portugal
84.8
/100
|
#140
Excellent
5.0%
Immigrants from Brazil
84.6
/100
|
#141
Excellent
5.0%
Immigrants from China
84.6
/100
|
#142
Excellent
5.0%
Immigrants from Egypt
83.4
/100
|
#143
Excellent
5.0%
Hmong
83.2
/100
|
#144
Excellent
5.0%
Immigrants from Spain
79.9
/100
|
#145
Good
5.0%
Mongolians
79.8
/100
|
#146
Good
5.0%
Syrians
78.7
/100
|
#147
Good
5.0%
Immigrants from Russia
78.7
/100
|
#148
Good
5.0%
Immigrants from Oceania
78.6
/100
|
#149
Good
5.0%
Brazilians
78.3
/100
|
#150
Good
5.0%
Immigrants from Cameroon
77.3
/100
|
#151
Good
5.0%
Albanians
77.2
/100
|
#152
Good
5.0%
Immigrants from Kuwait
76.3
/100
|
#153
Good
5.0%

Mongolian Married-Couple Family Poverty Correlation Summary

MeasurementMongolian DataMarried-Couple Family Poverty Data
Minimum0.014%0.35%
Maximum5.6%14.5%
Range5.6%14.1%
Mean1.2%5.0%
Median0.84%4.5%
Interquartile 25% (IQ1)0.40%2.9%
Interquartile 75% (IQ3)1.3%7.1%
Interquartile Range (IQR)0.87%4.1%
Standard Deviation (Sample)1.2%2.9%
Standard Deviation (Population)1.2%2.8%

Correlation Details

Mongolian PercentileSample SizeMarried-Couple Family Poverty
[
0.0%
-
0.5%
]
0.014%
81,088,5865.5%
[
0.0%
-
0.5%
]
0.047%
32,733,0555.5%
[
0.0%
-
0.5%
]
0.081%
10,093,7444.1%
[
0.0%
-
0.5%
]
0.12%
5,173,4254.5%
[
0.0%
-
0.5%
]
0.15%
3,476,8864.4%
[
0.0%
-
0.5%
]
0.18%
1,992,9694.4%
[
0.0%
-
0.5%
]
0.21%
1,170,4274.6%
[
0.0%
-
0.5%
]
0.25%
817,2054.8%
[
0.0%
-
0.5%
]
0.28%
621,0404.7%
[
0.0%
-
0.5%
]
0.32%
423,5444.8%
[
0.0%
-
0.5%
]
0.35%
389,2987.4%
[
0.0%
-
0.5%
]
0.39%
488,1133.2%
[
0.0%
-
0.5%
]
0.41%
209,7978.8%
[
0.0%
-
0.5%
]
0.45%
189,4253.5%
[
0.0%
-
0.5%
]
0.48%
211,9956.1%
[
0.5%
-
1.0%
]
0.53%
108,0278.6%
[
0.5%
-
1.0%
]
0.56%
16,6322.9%
[
0.5%
-
1.0%
]
0.59%
11,8464.3%
[
0.5%
-
1.0%
]
0.63%
114,7268.7%
[
0.5%
-
1.0%
]
0.65%
30,1898.6%
[
0.5%
-
1.0%
]
0.68%
101,3596.7%
[
0.5%
-
1.0%
]
0.75%
34,6264.5%
[
0.5%
-
1.0%
]
0.78%
9023.9%
[
0.5%
-
1.0%
]
0.83%
28,3572.9%
[
0.5%
-
1.0%
]
0.85%
18,7458.4%
[
0.5%
-
1.0%
]
0.88%
27,2652.9%
[
0.5%
-
1.0%
]
0.92%
35,2388.0%
[
0.5%
-
1.0%
]
0.95%
33,5440.75%
[
0.5%
-
1.0%
]
0.99%
16,7201.0%
[
1.0%
-
1.5%
]
1.03%
20,7590.54%
[
1.0%
-
1.5%
]
1.06%
3,5792.7%
[
1.0%
-
1.5%
]
1.12%
27,5762.5%
[
1.0%
-
1.5%
]
1.16%
6928.4%
[
1.0%
-
1.5%
]
1.20%
5,0681.4%
[
1.0%
-
1.5%
]
1.21%
20,0438.6%
[
1.0%
-
1.5%
]
1.25%
19,1821.4%
[
1.0%
-
1.5%
]
1.29%
46,9666.6%
[
1.0%
-
1.5%
]
1.42%
25,1171.5%
[
1.5%
-
2.0%
]
1.55%
19,8138.1%
[
1.5%
-
2.0%
]
1.66%
2,7667.6%
[
1.5%
-
2.0%
]
1.70%
5,9281.5%
[
2.0%
-
2.5%
]
2.41%
1,5740.35%
[
2.5%
-
3.0%
]
2.75%
54514.5%
[
3.0%
-
3.5%
]
3.13%
1,6933.8%
[
3.0%
-
3.5%
]
3.43%
12,3873.8%
[
3.5%
-
4.0%
]
3.97%
1,0346.2%
[
4.0%
-
4.5%
]
4.05%
1,0136.4%
[
5.5%
-
6.0%
]
5.57%
1,9754.1%