Mongolian GED/Equivalency
COMPARE
Mongolian
Select to Compare
GED/Equivalency
Mongolian GED/Equivalency
87.0%
GED/EQUIVALENCY
94.6/ 100
METRIC RATING
115th/ 347
METRIC RANK
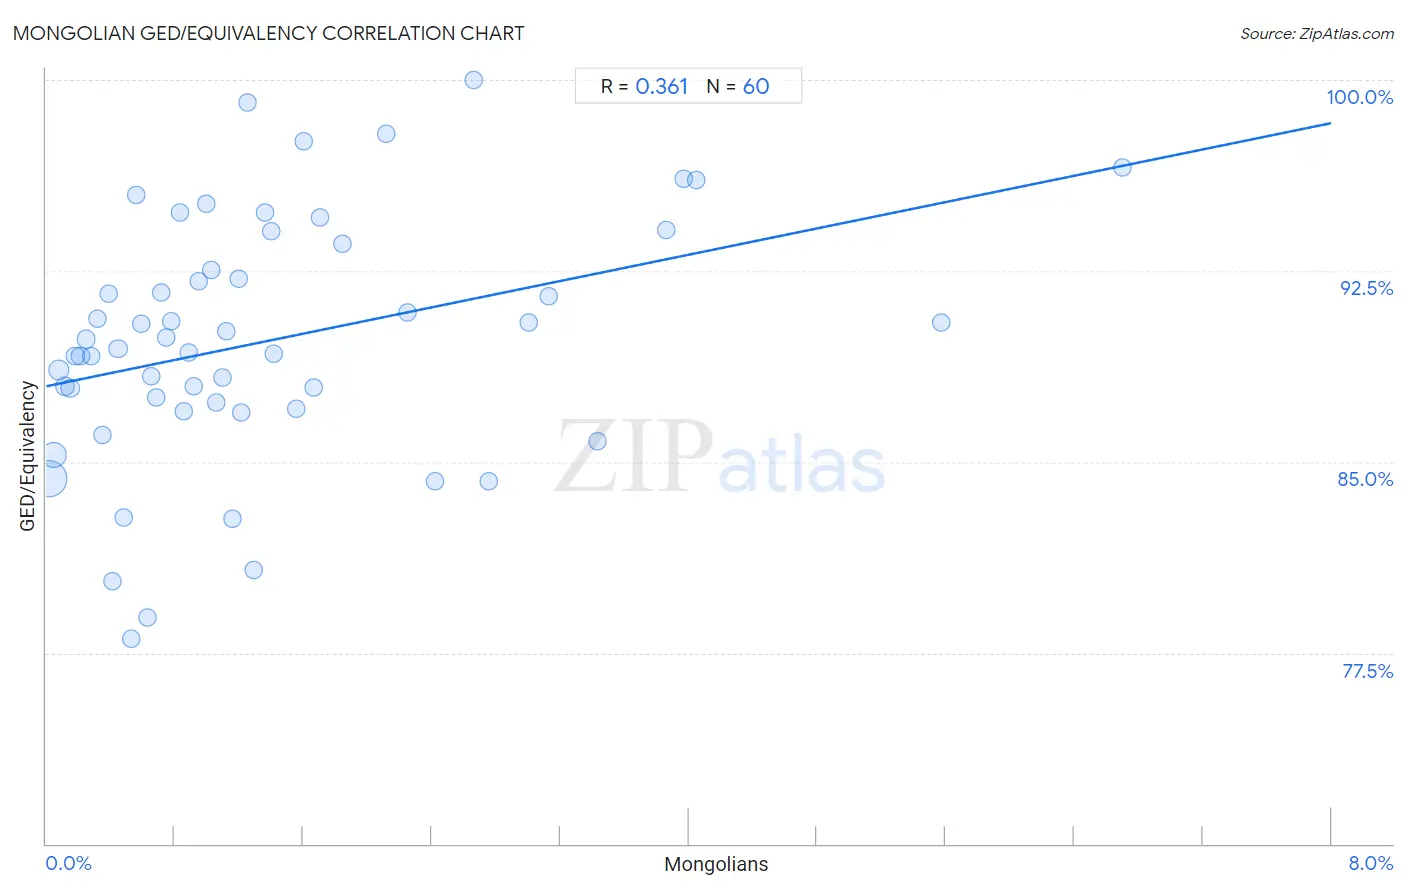
Mongolian GED/Equivalency Correlation Chart
The statistical analysis conducted on geographies consisting of 140,361,663 people shows a mild positive correlation between the proportion of Mongolians and percentage of population with at least ged/equivalency education in the United States with a correlation coefficient (R) of 0.361 and weighted average of 87.0%. On average, for every 1% (one percent) increase in Mongolians within a typical geography, there is an increase of 1.3% in percentage of population with at least ged/equivalency education.
It is essential to understand that the correlation between the percentage of Mongolians and percentage of population with at least ged/equivalency education does not imply a direct cause-and-effect relationship. It remains uncertain whether the presence of Mongolians influences an upward or downward trend in the level of percentage of population with at least ged/equivalency education within an area, or if Mongolians simply ended up residing in those areas with higher or lower levels of percentage of population with at least ged/equivalency education due to other factors.
Demographics Similar to Mongolians by GED/Equivalency
In terms of ged/equivalency, the demographic groups most similar to Mongolians are Immigrants from Kazakhstan (87.0%, a difference of 0.010%), Swiss (87.0%, a difference of 0.010%), Tlingit-Haida (87.0%, a difference of 0.020%), Assyrian/Chaldean/Syriac (87.0%, a difference of 0.020%), and French (87.1%, a difference of 0.060%).
| Demographics | Rating | Rank | GED/Equivalency |
| Canadians | 95.6 /100 | #108 | Exceptional 87.1% |
| Immigrants from Eastern Europe | 95.5 /100 | #109 | Exceptional 87.1% |
| Egyptians | 95.3 /100 | #110 | Exceptional 87.1% |
| French | 95.2 /100 | #111 | Exceptional 87.1% |
| Tlingit-Haida | 94.8 /100 | #112 | Exceptional 87.0% |
| Assyrians/Chaldeans/Syriacs | 94.8 /100 | #113 | Exceptional 87.0% |
| Immigrants from Kazakhstan | 94.7 /100 | #114 | Exceptional 87.0% |
| Mongolians | 94.6 /100 | #115 | Exceptional 87.0% |
| Swiss | 94.5 /100 | #116 | Exceptional 87.0% |
| Immigrants from Hong Kong | 93.8 /100 | #117 | Exceptional 86.9% |
| French Canadians | 93.2 /100 | #118 | Exceptional 86.9% |
| Immigrants from China | 93.2 /100 | #119 | Exceptional 86.9% |
| Scotch-Irish | 91.6 /100 | #120 | Exceptional 86.8% |
| Immigrants from Lebanon | 90.9 /100 | #121 | Exceptional 86.8% |
| Immigrants from Jordan | 90.8 /100 | #122 | Exceptional 86.8% |
Mongolian GED/Equivalency Correlation Summary
| Measurement | Mongolian Data | GED/Equivalency Data |
| Minimum | 0.014% | 78.1% |
| Maximum | 6.7% | 100.0% |
| Range | 6.7% | 21.9% |
| Mean | 1.4% | 89.8% |
| Median | 1.0% | 89.6% |
| Interquartile 25% (IQ1) | 0.51% | 87.2% |
| Interquartile 75% (IQ3) | 1.7% | 93.1% |
| Interquartile Range (IQR) | 1.2% | 5.8% |
| Standard Deviation (Sample) | 1.4% | 4.8% |
| Standard Deviation (Population) | 1.3% | 4.8% |
Correlation Details
| Mongolian Percentile | Sample Size | GED/Equivalency |
[ 0.0% - 0.5% ] 0.014% | 81,115,098 | 84.3% |
[ 0.0% - 0.5% ] 0.047% | 32,831,127 | 85.3% |
[ 0.0% - 0.5% ] 0.081% | 10,153,685 | 88.6% |
[ 0.0% - 0.5% ] 0.12% | 5,228,843 | 88.0% |
[ 0.0% - 0.5% ] 0.15% | 3,495,152 | 87.9% |
[ 0.0% - 0.5% ] 0.18% | 2,021,459 | 89.2% |
[ 0.0% - 0.5% ] 0.21% | 1,193,373 | 89.2% |
[ 0.0% - 0.5% ] 0.25% | 854,926 | 89.8% |
[ 0.0% - 0.5% ] 0.28% | 651,590 | 89.2% |
[ 0.0% - 0.5% ] 0.32% | 428,866 | 90.6% |
[ 0.0% - 0.5% ] 0.35% | 405,453 | 86.1% |
[ 0.0% - 0.5% ] 0.39% | 507,903 | 91.6% |
[ 0.0% - 0.5% ] 0.41% | 209,797 | 80.3% |
[ 0.0% - 0.5% ] 0.45% | 196,271 | 89.4% |
[ 0.0% - 0.5% ] 0.48% | 211,995 | 82.8% |
[ 0.5% - 1.0% ] 0.53% | 108,027 | 78.1% |
[ 0.5% - 1.0% ] 0.56% | 17,861 | 95.5% |
[ 0.5% - 1.0% ] 0.59% | 13,931 | 90.4% |
[ 0.5% - 1.0% ] 0.63% | 114,726 | 78.9% |
[ 0.5% - 1.0% ] 0.65% | 30,189 | 88.3% |
[ 0.5% - 1.0% ] 0.68% | 101,359 | 87.5% |
[ 0.5% - 1.0% ] 0.72% | 7,934 | 91.6% |
[ 0.5% - 1.0% ] 0.75% | 34,626 | 89.9% |
[ 0.5% - 1.0% ] 0.78% | 902 | 90.5% |
[ 0.5% - 1.0% ] 0.83% | 28,357 | 94.8% |
[ 0.5% - 1.0% ] 0.85% | 18,745 | 87.0% |
[ 0.5% - 1.0% ] 0.89% | 35,172 | 89.3% |
[ 0.5% - 1.0% ] 0.92% | 35,238 | 88.0% |
[ 0.5% - 1.0% ] 0.95% | 33,544 | 92.1% |
[ 0.5% - 1.0% ] 0.99% | 16,720 | 95.2% |
[ 1.0% - 1.5% ] 1.03% | 20,759 | 92.5% |
[ 1.0% - 1.5% ] 1.06% | 3,579 | 87.3% |
[ 1.0% - 1.5% ] 1.10% | 638 | 88.3% |
[ 1.0% - 1.5% ] 1.12% | 34,201 | 90.1% |
[ 1.0% - 1.5% ] 1.16% | 692 | 82.8% |
[ 1.0% - 1.5% ] 1.20% | 5,742 | 92.2% |
[ 1.0% - 1.5% ] 1.21% | 21,113 | 87.0% |
[ 1.0% - 1.5% ] 1.25% | 19,182 | 99.1% |
[ 1.0% - 1.5% ] 1.29% | 46,966 | 80.8% |
[ 1.0% - 1.5% ] 1.36% | 806 | 94.8% |
[ 1.0% - 1.5% ] 1.40% | 500 | 94.1% |
[ 1.0% - 1.5% ] 1.42% | 25,117 | 89.3% |
[ 1.5% - 2.0% ] 1.56% | 22,043 | 87.1% |
[ 1.5% - 2.0% ] 1.60% | 5,299 | 97.6% |
[ 1.5% - 2.0% ] 1.66% | 2,766 | 87.9% |
[ 1.5% - 2.0% ] 1.70% | 5,928 | 94.6% |
[ 1.5% - 2.0% ] 1.84% | 1,573 | 93.6% |
[ 2.0% - 2.5% ] 2.11% | 1,703 | 97.9% |
[ 2.0% - 2.5% ] 2.25% | 9,512 | 90.9% |
[ 2.0% - 2.5% ] 2.42% | 2,605 | 84.2% |
[ 2.5% - 3.0% ] 2.66% | 2,632 | 100.0% |
[ 2.5% - 3.0% ] 2.75% | 545 | 84.3% |
[ 3.0% - 3.5% ] 3.01% | 1,164 | 90.5% |
[ 3.0% - 3.5% ] 3.13% | 1,693 | 91.5% |
[ 3.0% - 3.5% ] 3.43% | 12,387 | 85.8% |
[ 3.5% - 4.0% ] 3.86% | 4,120 | 94.1% |
[ 3.5% - 4.0% ] 3.97% | 1,034 | 96.1% |
[ 4.0% - 4.5% ] 4.05% | 1,013 | 96.0% |
[ 5.5% - 6.0% ] 5.57% | 1,975 | 90.5% |
[ 6.5% - 7.0% ] 6.70% | 1,507 | 96.5% |