Mongolian 2 or more Vehicles in Household
COMPARE
Mongolian
Select to Compare
2 or more Vehicles in Household
Mongolian 2 or more Vehicles in Household
52.8%
2+ VEHICLES AVAILABLE
1.0/ 100
METRIC RATING
250th/ 347
METRIC RANK
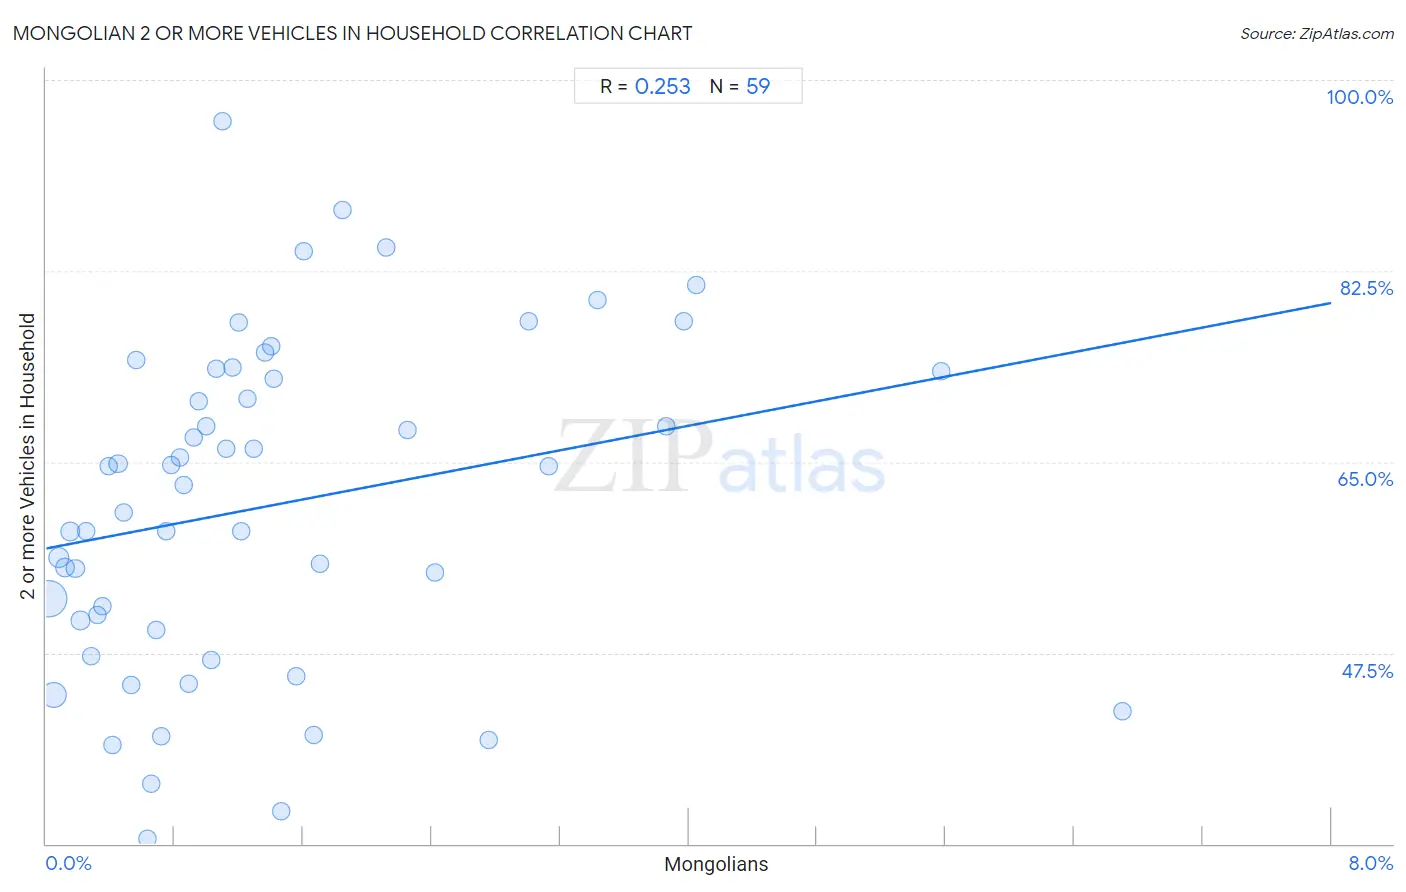
Mongolian 2 or more Vehicles in Household Correlation Chart
The statistical analysis conducted on geographies consisting of 140,284,468 people shows a weak positive correlation between the proportion of Mongolians and percentage of households with 2 or more vehicles available in the United States with a correlation coefficient (R) of 0.253 and weighted average of 52.8%. On average, for every 1% (one percent) increase in Mongolians within a typical geography, there is an increase of 2.8% in percentage of households with 2 or more vehicles available.
It is essential to understand that the correlation between the percentage of Mongolians and percentage of households with 2 or more vehicles available does not imply a direct cause-and-effect relationship. It remains uncertain whether the presence of Mongolians influences an upward or downward trend in the level of percentage of households with 2 or more vehicles available within an area, or if Mongolians simply ended up residing in those areas with higher or lower levels of percentage of households with 2 or more vehicles available due to other factors.
Demographics Similar to Mongolians by 2 or more Vehicles in Household
In terms of 2 or more vehicles in household, the demographic groups most similar to Mongolians are Immigrants from Brazil (52.8%, a difference of 0.0%), Immigrants from Sudan (52.8%, a difference of 0.030%), Immigrants from Portugal (52.8%, a difference of 0.050%), Colombian (52.9%, a difference of 0.060%), and Nigerian (52.8%, a difference of 0.10%).
| Demographics | Rating | Rank | 2 or more Vehicles in Household |
| Ethiopians | 1.7 /100 | #243 | Tragic 53.1% |
| Indians (Asian) | 1.7 /100 | #244 | Tragic 53.1% |
| Immigrants from Ethiopia | 1.5 /100 | #245 | Tragic 53.0% |
| Immigrants from Nigeria | 1.2 /100 | #246 | Tragic 52.9% |
| Sierra Leoneans | 1.2 /100 | #247 | Tragic 52.9% |
| Colombians | 1.1 /100 | #248 | Tragic 52.9% |
| Immigrants from Brazil | 1.0 /100 | #249 | Tragic 52.8% |
| Mongolians | 1.0 /100 | #250 | Tragic 52.8% |
| Immigrants from Sudan | 1.0 /100 | #251 | Tragic 52.8% |
| Immigrants from Portugal | 1.0 /100 | #252 | Tragic 52.8% |
| Nigerians | 0.9 /100 | #253 | Tragic 52.8% |
| Immigrants from Malaysia | 0.8 /100 | #254 | Tragic 52.7% |
| Uruguayans | 0.7 /100 | #255 | Tragic 52.7% |
| Immigrants from Eritrea | 0.7 /100 | #256 | Tragic 52.6% |
| Immigrants from Hong Kong | 0.6 /100 | #257 | Tragic 52.6% |
Mongolian 2 or more Vehicles in Household Correlation Summary
| Measurement | Mongolian Data | 2 or more Vehicles in Household Data |
| Minimum | 0.014% | 30.5% |
| Maximum | 6.7% | 96.2% |
| Range | 6.7% | 65.7% |
| Mean | 1.4% | 61.0% |
| Median | 1.0% | 62.9% |
| Interquartile 25% (IQ1) | 0.48% | 49.5% |
| Interquartile 75% (IQ3) | 1.7% | 73.3% |
| Interquartile Range (IQR) | 1.2% | 23.7% |
| Standard Deviation (Sample) | 1.4% | 15.0% |
| Standard Deviation (Population) | 1.3% | 14.9% |
Correlation Details
| Mongolian Percentile | Sample Size | 2 or more Vehicles in Household |
[ 0.0% - 0.5% ] 0.014% | 81,115,098 | 52.5% |
[ 0.0% - 0.5% ] 0.047% | 32,810,917 | 43.7% |
[ 0.0% - 0.5% ] 0.081% | 10,144,930 | 56.2% |
[ 0.0% - 0.5% ] 0.12% | 5,225,757 | 55.3% |
[ 0.0% - 0.5% ] 0.15% | 3,495,152 | 58.6% |
[ 0.0% - 0.5% ] 0.18% | 2,016,955 | 55.2% |
[ 0.0% - 0.5% ] 0.21% | 1,190,674 | 50.5% |
[ 0.0% - 0.5% ] 0.25% | 853,026 | 58.7% |
[ 0.0% - 0.5% ] 0.28% | 640,056 | 47.2% |
[ 0.0% - 0.5% ] 0.32% | 428,866 | 51.0% |
[ 0.0% - 0.5% ] 0.35% | 405,453 | 51.7% |
[ 0.0% - 0.5% ] 0.39% | 503,425 | 64.6% |
[ 0.0% - 0.5% ] 0.41% | 209,797 | 39.1% |
[ 0.0% - 0.5% ] 0.45% | 196,271 | 64.8% |
[ 0.0% - 0.5% ] 0.48% | 211,995 | 60.4% |
[ 0.5% - 1.0% ] 0.53% | 108,027 | 44.6% |
[ 0.5% - 1.0% ] 0.56% | 16,632 | 74.4% |
[ 0.5% - 1.0% ] 0.63% | 114,726 | 30.5% |
[ 0.5% - 1.0% ] 0.65% | 30,189 | 35.4% |
[ 0.5% - 1.0% ] 0.68% | 101,359 | 49.5% |
[ 0.5% - 1.0% ] 0.71% | 6,028 | 39.8% |
[ 0.5% - 1.0% ] 0.75% | 34,626 | 58.7% |
[ 0.5% - 1.0% ] 0.78% | 902 | 64.7% |
[ 0.5% - 1.0% ] 0.83% | 28,357 | 65.4% |
[ 0.5% - 1.0% ] 0.85% | 18,745 | 62.9% |
[ 0.5% - 1.0% ] 0.89% | 35,172 | 44.6% |
[ 0.5% - 1.0% ] 0.92% | 35,238 | 67.2% |
[ 0.5% - 1.0% ] 0.95% | 33,544 | 70.5% |
[ 0.5% - 1.0% ] 0.99% | 16,720 | 68.3% |
[ 1.0% - 1.5% ] 1.03% | 20,759 | 46.8% |
[ 1.0% - 1.5% ] 1.06% | 3,579 | 73.5% |
[ 1.0% - 1.5% ] 1.10% | 638 | 96.2% |
[ 1.0% - 1.5% ] 1.12% | 34,201 | 66.3% |
[ 1.0% - 1.5% ] 1.16% | 692 | 73.7% |
[ 1.0% - 1.5% ] 1.20% | 5,742 | 77.8% |
[ 1.0% - 1.5% ] 1.21% | 21,113 | 58.7% |
[ 1.0% - 1.5% ] 1.25% | 19,182 | 70.8% |
[ 1.0% - 1.5% ] 1.29% | 46,966 | 66.2% |
[ 1.0% - 1.5% ] 1.36% | 806 | 75.0% |
[ 1.0% - 1.5% ] 1.40% | 500 | 75.6% |
[ 1.0% - 1.5% ] 1.42% | 25,117 | 72.7% |
[ 1.0% - 1.5% ] 1.47% | 341 | 32.9% |
[ 1.5% - 2.0% ] 1.56% | 22,043 | 45.4% |
[ 1.5% - 2.0% ] 1.60% | 5,299 | 84.3% |
[ 1.5% - 2.0% ] 1.66% | 2,766 | 39.9% |
[ 1.5% - 2.0% ] 1.70% | 5,928 | 55.7% |
[ 1.5% - 2.0% ] 1.84% | 1,573 | 88.1% |
[ 2.0% - 2.5% ] 2.11% | 1,703 | 84.7% |
[ 2.0% - 2.5% ] 2.25% | 9,512 | 67.9% |
[ 2.0% - 2.5% ] 2.42% | 2,605 | 54.8% |
[ 2.5% - 3.0% ] 2.75% | 545 | 39.6% |
[ 3.0% - 3.5% ] 3.01% | 1,164 | 77.9% |
[ 3.0% - 3.5% ] 3.13% | 1,693 | 64.6% |
[ 3.0% - 3.5% ] 3.43% | 12,387 | 79.8% |
[ 3.5% - 4.0% ] 3.86% | 3,448 | 68.3% |
[ 3.5% - 4.0% ] 3.97% | 1,034 | 77.9% |
[ 4.0% - 4.5% ] 4.05% | 1,013 | 81.2% |
[ 5.5% - 6.0% ] 5.57% | 1,975 | 73.3% |
[ 6.5% - 7.0% ] 6.70% | 1,507 | 42.1% |