Menominee 3 or more Vehicles in Household

COMPARE

Menominee
Race
Ancestry
AfghanAfricanAlaska NativeAlaskan AthabascanAlbanianAleutAlsatianAmericanApacheArabArapahoArgentineanArmenianAssyrian/Chaldean/SyriacAustralianAustrianBahamianBangladeshiBarbadianBasqueBelgianBelizeanBermudanBhutaneseBlackfeetBolivianBrazilianBritishBritish West IndianBulgarianBurmeseCajunCambodianCanadianCape VerdeanCarpatho RusynCelticCentral AmericanCentral American IndianCherokeeCheyenneChickasawChileanChineseChippewaChoctawColombianColvilleComancheCosta RicanCreeCreekCroatianCrowCubanCypriotCzechCzechoslovakianDanishDelawareDominicanDutchDutch West IndianEastern EuropeanEcuadorianEgyptianEnglishEstonianEthiopianEuropeanFijianFilipinoFinnishFrenchFrench American IndianFrench CanadianGermanGerman RussianGhanaianGreekGuamanian/ChamorroGuatemalanGuyaneseHaitianHmongHonduranHopiHoumaHungarianIcelanderIndian (Asian)IndonesianInupiatIranianIraqiIrishIroquoisIsraeliItalianJamaicanJapaneseJordanianKenyanKiowaKoreanLaotianLatvianLebaneseLiberianLithuanianLumbeeLuxembourgerMacedonianMalaysianMalteseMarshalleseMenomineeMexicanMexican American IndianMongolianMoroccanNative HawaiianNavajoNepaleseNew ZealanderNicaraguanNigerianNorthern EuropeanNorwegianOkinawanOsageOttawaPaiutePakistaniPalestinianPanamanianParaguayanPennsylvania GermanPeruvianPimaPolishPortuguesePotawatomiPuebloPuerto RicanPuget Sound SalishRomanianRussianSalvadoranSamoanScandinavianScotch-IrishScottishSeminoleSenegaleseSerbianShoshoneSierra LeoneanSiouxSlavicSlovakSloveneSomaliSouth AfricanSouth AmericanSouth American IndianSoviet UnionSpaniardSpanishSpanish AmericanSpanish American IndianSri LankanSubsaharan AfricanSudaneseSwedishSwissSyrianTaiwaneseThaiTlingit-HaidaTohono O'OdhamTonganTrinidadian and TobagonianTsimshianTurkishU.S. Virgin IslanderUgandanUkrainianUruguayanUteVenezuelanVietnameseWelshWest IndianYakamaYaquiYugoslavianYumanYup'ikZimbabwean
Immigration
NonimmigrantsImmigrantsAfghanistanAfricaAlbaniaArgentinaArmeniaAsiaAustraliaAustriaBahamasBangladeshBarbadosBelarusBelgiumBelizeBoliviaBosnia and HerzegovinaBrazilBulgariaBurma/MyanmarCabo VerdeCambodiaCameroonCanadaCaribbeanCentral AmericaChileChinaColombiaCongoCosta RicaCroatiaCubaCzechoslovakiaDenmarkDominicaDominican RepublicEastern AfricaEastern AsiaEastern EuropeEcuadorEgyptEl SalvadorEnglandEritreaEthiopiaEuropeFijiFranceGermanyGhanaGreeceGrenadaGuatemalaGuyanaHaitiHondurasHong KongHungaryIndiaIndonesiaIranIraqIrelandIsraelItalyJamaicaJapanJordanKazakhstanKenyaKoreaKuwaitLaosLatin AmericaLatviaLebanonLiberiaLithuaniaMalaysiaMexicoMicronesiaMiddle AfricaMoldovaMoroccoNepalNetherlandsNicaraguaNigeriaNorth AmericaNorth MacedoniaNorthern AfricaNorthern EuropeNorwayOceaniaPakistanPanamaPeruPhilippinesPolandPortugalRomaniaRussiaSaudi ArabiaScotlandSenegalSerbiaSierra LeoneSingaporeSomaliaSouth AfricaSouth AmericaSouth Central AsiaSouth Eastern AsiaSouthern EuropeSpainSri LankaSt. Vincent and the GrenadinesSudanSwedenSwitzerlandSyriaTaiwanThailandTrinidad and TobagoTurkeyUgandaUkraineUruguayUzbekistanVenezuelaVietnamWest IndiesWestern AfricaWestern AsiaWestern EuropeYemenZaireZimbabweAzores
Select to Compare
Race
Ancestry
AfghanAfricanAlaska NativeAlaskan AthabascanAlbanianAleutAlsatianAmericanApacheArabArapahoArgentineanArmenianAssyrian/Chaldean/SyriacAustralianAustrianBahamianBangladeshiBarbadianBasqueBelgianBelizeanBermudanBhutaneseBlackfeetBolivianBrazilianBritishBritish West IndianBulgarianBurmeseCajunCambodianCanadianCape VerdeanCarpatho RusynCelticCentral AmericanCentral American IndianCherokeeCheyenneChickasawChileanChineseChippewaChoctawColombianColvilleComancheCosta RicanCreeCreekCroatianCrowCubanCypriotCzechCzechoslovakianDanishDelawareDominicanDutchDutch West IndianEastern EuropeanEcuadorianEgyptianEnglishEstonianEthiopianEuropeanFijianFilipinoFinnishFrenchFrench American IndianFrench CanadianGermanGerman RussianGhanaianGreekGuamanian/ChamorroGuatemalanGuyaneseHaitianHmongHonduranHopiHoumaHungarianIcelanderIndian (Asian)IndonesianInupiatIranianIraqiIrishIroquoisIsraeliItalianJamaicanJapaneseJordanianKenyanKiowaKoreanLaotianLatvianLebaneseLiberianLithuanianLumbeeLuxembourgerMacedonianMalaysianMalteseMarshalleseMexicanMexican American IndianMongolianMoroccanNative HawaiianNavajoNepaleseNew ZealanderNicaraguanNigerianNorthern EuropeanNorwegianOkinawanOsageOttawaPaiutePakistaniPalestinianPanamanianParaguayanPennsylvania GermanPeruvianPimaPolishPortuguesePotawatomiPuebloPuerto RicanPuget Sound SalishRomanianRussianSalvadoranSamoanScandinavianScotch-IrishScottishSeminoleSenegaleseSerbianShoshoneSierra LeoneanSiouxSlavicSlovakSloveneSomaliSouth AfricanSouth AmericanSouth American IndianSoviet UnionSpaniardSpanishSpanish AmericanSpanish American IndianSri LankanSubsaharan AfricanSudaneseSwedishSwissSyrianTaiwaneseThaiTlingit-HaidaTohono O'OdhamTonganTrinidadian and TobagonianTsimshianTurkishU.S. Virgin IslanderUgandanUkrainianUruguayanUteVenezuelanVietnameseWelshWest IndianYakamaYaquiYugoslavianYumanYup'ikZimbabwean
Immigration
NonimmigrantsImmigrantsAfghanistanAfricaAlbaniaArgentinaArmeniaAsiaAustraliaAustriaBahamasBangladeshBarbadosBelarusBelgiumBelizeBoliviaBosnia and HerzegovinaBrazilBulgariaBurma/MyanmarCabo VerdeCambodiaCameroonCanadaCaribbeanCentral AmericaChileChinaColombiaCongoCosta RicaCroatiaCubaCzechoslovakiaDenmarkDominicaDominican RepublicEastern AfricaEastern AsiaEastern EuropeEcuadorEgyptEl SalvadorEnglandEritreaEthiopiaEuropeFijiFranceGermanyGhanaGreeceGrenadaGuatemalaGuyanaHaitiHondurasHong KongHungaryIndiaIndonesiaIranIraqIrelandIsraelItalyJamaicaJapanJordanKazakhstanKenyaKoreaKuwaitLaosLatin AmericaLatviaLebanonLiberiaLithuaniaMalaysiaMexicoMicronesiaMiddle AfricaMoldovaMoroccoNepalNetherlandsNicaraguaNigeriaNorth AmericaNorth MacedoniaNorthern AfricaNorthern EuropeNorwayOceaniaPakistanPanamaPeruPhilippinesPolandPortugalRomaniaRussiaSaudi ArabiaScotlandSenegalSerbiaSierra LeoneSingaporeSomaliaSouth AfricaSouth AmericaSouth Central AsiaSouth Eastern AsiaSouthern EuropeSpainSri LankaSt. Vincent and the GrenadinesSudanSwedenSwitzerlandSyriaTaiwanThailandTrinidad and TobagoTurkeyUgandaUkraineUruguayUzbekistanVenezuelaVietnamWest IndiesWestern AfricaWestern AsiaWestern EuropeYemenZaireZimbabweAzores
3 or more Vehicles in Household
Income
Poverty
Unemployment
Labor Participation
Family Structure
Vehicle Availability
Education Level
Disability

Menominee 3 or more Vehicles in Household
Tragic

17.2%
3+ VEHICLES AVAILABLE
0.2/ 100
METRIC RATING
286th/ 347
METRIC RANK

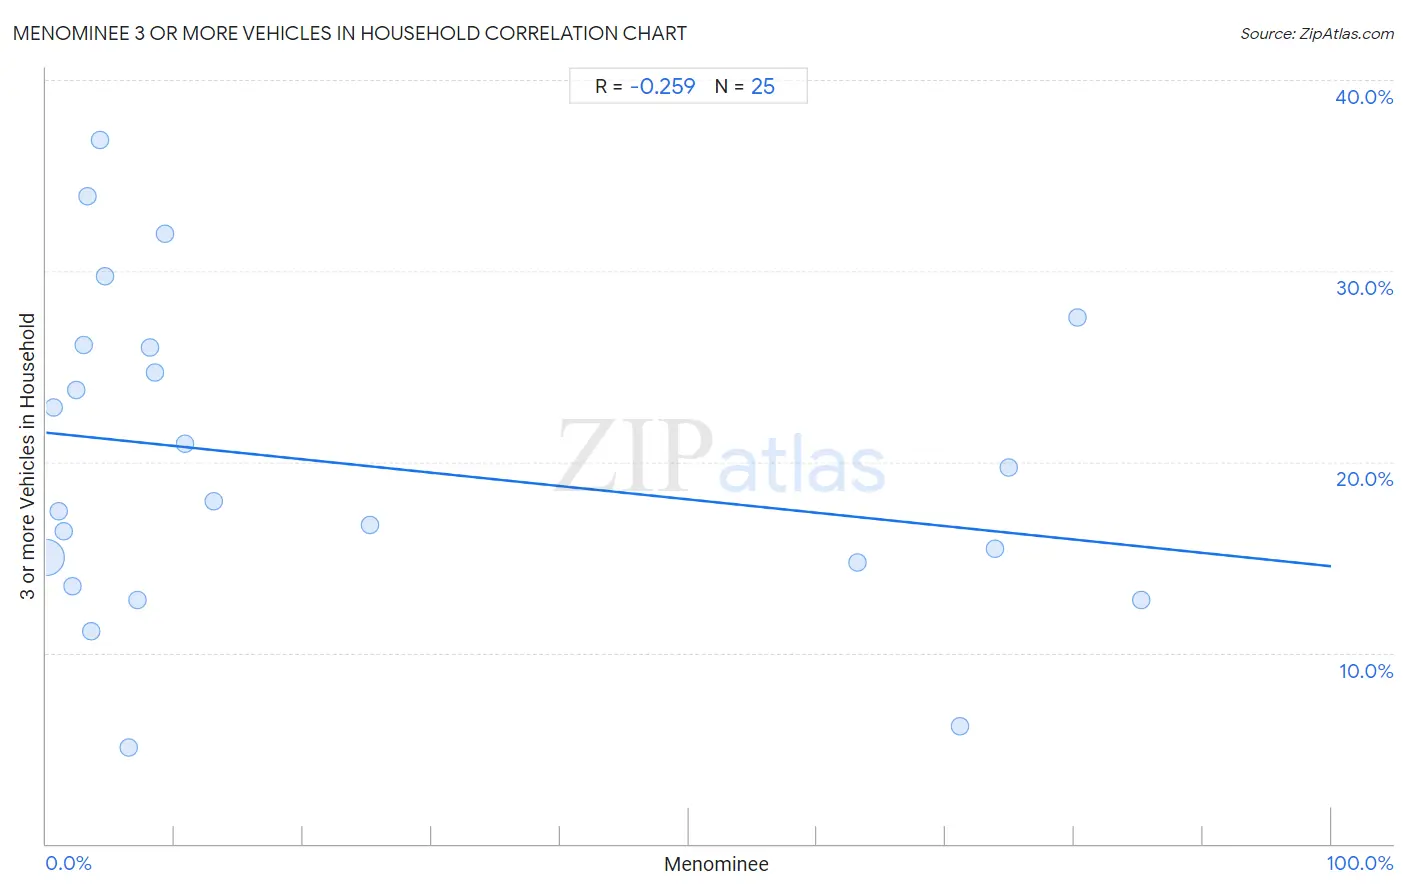
Menominee 3 or more Vehicles in Household Correlation Chart

The statistical analysis conducted on geographies consisting of 45,777,699 people shows a weak negative correlation between the proportion of Menominee and percentage of households with 3 or more vehicles available in the United States with a correlation coefficient (R) of -0.259 and weighted average of 17.2%. On average, for every 1% (one percent) increase in Menominee within a typical geography, there is a decrease of 0.070% in percentage of households with 3 or more vehicles available.
Menominee 3 or more Vehicles in Household
It is essential to understand that the correlation between the percentage of Menominee and percentage of households with 3 or more vehicles available does not imply a direct cause-and-effect relationship. It remains uncertain whether the presence of Menominee influences an upward or downward trend in the level of percentage of households with 3 or more vehicles available within an area, or if Menominee simply ended up residing in those areas with higher or lower levels of percentage of households with 3 or more vehicles available due to other factors.

Demographics Similar to Menominee by 3 or more Vehicles in Household

In terms of 3 or more vehicles in household, the demographic groups most similar to Menominee are Immigrants from Croatia (17.2%, a difference of 0.060%), Immigrants from Brazil (17.1%, a difference of 0.30%), Immigrants from Uruguay (17.1%, a difference of 0.39%), Immigrants from Liberia (17.1%, a difference of 0.46%), and Immigrants from Colombia (17.3%, a difference of 0.79%).
DemographicsRating | Rank3 or more Vehicles in Household
Immigrants from Kazakhstan
0.3
/100
|
#279
Tragic
17.4%
Immigrants from Eastern Europe
0.3
/100
|
#280
Tragic
17.4%
Immigrants from Latvia
0.3
/100
|
#281
Tragic
17.4%
Immigrants from Ireland
0.3
/100
|
#282
Tragic
17.3%
Blacks/African Americans
0.3
/100
|
#283
Tragic
17.3%
Immigrants from Colombia
0.3
/100
|
#284
Tragic
17.3%
Immigrants from Croatia
0.2
/100
|
#285
Tragic
17.2%
Menominee
0.2
/100
|
#286
Tragic
17.2%
Immigrants from Brazil
0.2
/100
|
#287
Tragic
17.1%
Immigrants from Uruguay
0.2
/100
|
#288
Tragic
17.1%
Immigrants from Liberia
0.1
/100
|
#289
Tragic
17.1%
Liberians
0.1
/100
|
#290
Tragic
17.0%
Immigrants from Congo
0.1
/100
|
#291
Tragic
17.0%
Immigrants from Spain
0.1
/100
|
#292
Tragic
17.0%
Bahamians
0.1
/100
|
#293
Tragic
16.9%

Menominee 3 or more Vehicles in Household Correlation Summary

MeasurementMenominee Data3 or more Vehicles in Household Data
Minimum0.023%5.1%
Maximum85.2%36.9%
Range85.2%31.8%
Mean22.5%20.0%
Median7.1%18.0%
Interquartile 25% (IQ1)2.6%14.1%
Interquartile 75% (IQ3)44.2%26.1%
Interquartile Range (IQR)41.6%12.0%
Standard Deviation (Sample)30.6%8.3%
Standard Deviation (Population)30.0%8.1%

Correlation Details

Menominee PercentileSample Size3 or more Vehicles in Household
[
0.0%
-
0.5%
]
0.023%
45,255,28815.0%
[
0.5%
-
1.0%
]
0.57%
288,30122.9%
[
0.5%
-
1.0%
]
1.00%
151,07917.4%
[
1.0%
-
1.5%
]
1.39%
27,37116.3%
[
2.0%
-
2.5%
]
2.02%
4,65613.5%
[
2.0%
-
2.5%
]
2.34%
1,83723.8%
[
2.5%
-
3.0%
]
2.89%
4,36526.1%
[
3.0%
-
3.5%
]
3.19%
3,13333.9%
[
3.0%
-
3.5%
]
3.46%
2,16511.1%
[
4.0%
-
4.5%
]
4.22%
52136.9%
[
4.5%
-
5.0%
]
4.62%
13029.7%
[
6.0%
-
6.5%
]
6.41%
2345.1%
[
7.0%
-
7.5%
]
7.08%
59312.8%
[
8.0%
-
8.5%
]
8.04%
1,60526.0%
[
8.0%
-
8.5%
]
8.48%
16,65724.7%
[
9.0%
-
9.5%
]
9.28%
2,10131.9%
[
10.5%
-
11.0%
]
10.77%
29721.0%
[
13.0%
-
13.5%
]
13.05%
9,21218.0%
[
25.0%
-
25.5%
]
25.21%
11916.7%
[
63.0%
-
63.5%
]
63.14%
1,53014.7%
[
71.0%
-
71.5%
]
71.10%
1736.1%
[
73.5%
-
74.0%
]
73.86%
3,05315.5%
[
74.5%
-
75.0%
]
74.87%
1,17019.7%
[
80.0%
-
80.5%
]
80.29%
68527.6%
[
85.0%
-
85.5%
]
85.18%
1,42412.8%