Menominee GED/Equivalency

COMPARE

Menominee
Race
Ancestry
AfghanAfricanAlaska NativeAlaskan AthabascanAlbanianAleutAlsatianAmericanApacheArabArapahoArgentineanArmenianAssyrian/Chaldean/SyriacAustralianAustrianBahamianBangladeshiBarbadianBasqueBelgianBelizeanBermudanBhutaneseBlackfeetBolivianBrazilianBritishBritish West IndianBulgarianBurmeseCajunCambodianCanadianCape VerdeanCarpatho RusynCelticCentral AmericanCentral American IndianCherokeeCheyenneChickasawChileanChineseChippewaChoctawColombianColvilleComancheCosta RicanCreeCreekCroatianCrowCubanCypriotCzechCzechoslovakianDanishDelawareDominicanDutchDutch West IndianEastern EuropeanEcuadorianEgyptianEnglishEstonianEthiopianEuropeanFijianFilipinoFinnishFrenchFrench American IndianFrench CanadianGermanGerman RussianGhanaianGreekGuamanian/ChamorroGuatemalanGuyaneseHaitianHmongHonduranHopiHoumaHungarianIcelanderIndian (Asian)IndonesianInupiatIranianIraqiIrishIroquoisIsraeliItalianJamaicanJapaneseJordanianKenyanKiowaKoreanLaotianLatvianLebaneseLiberianLithuanianLumbeeLuxembourgerMacedonianMalaysianMalteseMarshalleseMenomineeMexicanMexican American IndianMongolianMoroccanNative HawaiianNavajoNepaleseNew ZealanderNicaraguanNigerianNorthern EuropeanNorwegianOkinawanOsageOttawaPaiutePakistaniPalestinianPanamanianParaguayanPennsylvania GermanPeruvianPimaPolishPortuguesePotawatomiPuebloPuerto RicanPuget Sound SalishRomanianRussianSalvadoranSamoanScandinavianScotch-IrishScottishSeminoleSenegaleseSerbianShoshoneSierra LeoneanSiouxSlavicSlovakSloveneSomaliSouth AfricanSouth AmericanSouth American IndianSoviet UnionSpaniardSpanishSpanish AmericanSpanish American IndianSri LankanSubsaharan AfricanSudaneseSwedishSwissSyrianTaiwaneseThaiTlingit-HaidaTohono O'OdhamTonganTrinidadian and TobagonianTsimshianTurkishU.S. Virgin IslanderUgandanUkrainianUruguayanUteVenezuelanVietnameseWelshWest IndianYakamaYaquiYugoslavianYumanYup'ikZimbabwean
Immigration
NonimmigrantsImmigrantsAfghanistanAfricaAlbaniaArgentinaArmeniaAsiaAustraliaAustriaBahamasBangladeshBarbadosBelarusBelgiumBelizeBoliviaBosnia and HerzegovinaBrazilBulgariaBurma/MyanmarCabo VerdeCambodiaCameroonCanadaCaribbeanCentral AmericaChileChinaColombiaCongoCosta RicaCroatiaCubaCzechoslovakiaDenmarkDominicaDominican RepublicEastern AfricaEastern AsiaEastern EuropeEcuadorEgyptEl SalvadorEnglandEritreaEthiopiaEuropeFijiFranceGermanyGhanaGreeceGrenadaGuatemalaGuyanaHaitiHondurasHong KongHungaryIndiaIndonesiaIranIraqIrelandIsraelItalyJamaicaJapanJordanKazakhstanKenyaKoreaKuwaitLaosLatin AmericaLatviaLebanonLiberiaLithuaniaMalaysiaMexicoMicronesiaMiddle AfricaMoldovaMoroccoNepalNetherlandsNicaraguaNigeriaNorth AmericaNorth MacedoniaNorthern AfricaNorthern EuropeNorwayOceaniaPakistanPanamaPeruPhilippinesPolandPortugalRomaniaRussiaSaudi ArabiaScotlandSenegalSerbiaSierra LeoneSingaporeSomaliaSouth AfricaSouth AmericaSouth Central AsiaSouth Eastern AsiaSouthern EuropeSpainSri LankaSt. Vincent and the GrenadinesSudanSwedenSwitzerlandSyriaTaiwanThailandTrinidad and TobagoTurkeyUgandaUkraineUruguayUzbekistanVenezuelaVietnamWest IndiesWestern AfricaWestern AsiaWestern EuropeYemenZaireZimbabweAzores
Select to Compare
Race
Ancestry
AfghanAfricanAlaska NativeAlaskan AthabascanAlbanianAleutAlsatianAmericanApacheArabArapahoArgentineanArmenianAssyrian/Chaldean/SyriacAustralianAustrianBahamianBangladeshiBarbadianBasqueBelgianBelizeanBermudanBhutaneseBlackfeetBolivianBrazilianBritishBritish West IndianBulgarianBurmeseCajunCambodianCanadianCape VerdeanCarpatho RusynCelticCentral AmericanCentral American IndianCherokeeCheyenneChickasawChileanChineseChippewaChoctawColombianColvilleComancheCosta RicanCreeCreekCroatianCrowCubanCypriotCzechCzechoslovakianDanishDelawareDominicanDutchDutch West IndianEastern EuropeanEcuadorianEgyptianEnglishEstonianEthiopianEuropeanFijianFilipinoFinnishFrenchFrench American IndianFrench CanadianGermanGerman RussianGhanaianGreekGuamanian/ChamorroGuatemalanGuyaneseHaitianHmongHonduranHopiHoumaHungarianIcelanderIndian (Asian)IndonesianInupiatIranianIraqiIrishIroquoisIsraeliItalianJamaicanJapaneseJordanianKenyanKiowaKoreanLaotianLatvianLebaneseLiberianLithuanianLumbeeLuxembourgerMacedonianMalaysianMalteseMarshalleseMexicanMexican American IndianMongolianMoroccanNative HawaiianNavajoNepaleseNew ZealanderNicaraguanNigerianNorthern EuropeanNorwegianOkinawanOsageOttawaPaiutePakistaniPalestinianPanamanianParaguayanPennsylvania GermanPeruvianPimaPolishPortuguesePotawatomiPuebloPuerto RicanPuget Sound SalishRomanianRussianSalvadoranSamoanScandinavianScotch-IrishScottishSeminoleSenegaleseSerbianShoshoneSierra LeoneanSiouxSlavicSlovakSloveneSomaliSouth AfricanSouth AmericanSouth American IndianSoviet UnionSpaniardSpanishSpanish AmericanSpanish American IndianSri LankanSubsaharan AfricanSudaneseSwedishSwissSyrianTaiwaneseThaiTlingit-HaidaTohono O'OdhamTonganTrinidadian and TobagonianTsimshianTurkishU.S. Virgin IslanderUgandanUkrainianUruguayanUteVenezuelanVietnameseWelshWest IndianYakamaYaquiYugoslavianYumanYup'ikZimbabwean
Immigration
NonimmigrantsImmigrantsAfghanistanAfricaAlbaniaArgentinaArmeniaAsiaAustraliaAustriaBahamasBangladeshBarbadosBelarusBelgiumBelizeBoliviaBosnia and HerzegovinaBrazilBulgariaBurma/MyanmarCabo VerdeCambodiaCameroonCanadaCaribbeanCentral AmericaChileChinaColombiaCongoCosta RicaCroatiaCubaCzechoslovakiaDenmarkDominicaDominican RepublicEastern AfricaEastern AsiaEastern EuropeEcuadorEgyptEl SalvadorEnglandEritreaEthiopiaEuropeFijiFranceGermanyGhanaGreeceGrenadaGuatemalaGuyanaHaitiHondurasHong KongHungaryIndiaIndonesiaIranIraqIrelandIsraelItalyJamaicaJapanJordanKazakhstanKenyaKoreaKuwaitLaosLatin AmericaLatviaLebanonLiberiaLithuaniaMalaysiaMexicoMicronesiaMiddle AfricaMoldovaMoroccoNepalNetherlandsNicaraguaNigeriaNorth AmericaNorth MacedoniaNorthern AfricaNorthern EuropeNorwayOceaniaPakistanPanamaPeruPhilippinesPolandPortugalRomaniaRussiaSaudi ArabiaScotlandSenegalSerbiaSierra LeoneSingaporeSomaliaSouth AfricaSouth AmericaSouth Central AsiaSouth Eastern AsiaSouthern EuropeSpainSri LankaSt. Vincent and the GrenadinesSudanSwedenSwitzerlandSyriaTaiwanThailandTrinidad and TobagoTurkeyUgandaUkraineUruguayUzbekistanVenezuelaVietnamWest IndiesWestern AfricaWestern AsiaWestern EuropeYemenZaireZimbabweAzores
GED/Equivalency
Income
Poverty
Unemployment
Labor Participation
Family Structure
Vehicle Availability
Education Level
Disability

Menominee GED/Equivalency
Good

86.3%
GED/EQUIVALENCY
79.3/ 100
METRIC RATING
149th/ 347
METRIC RANK

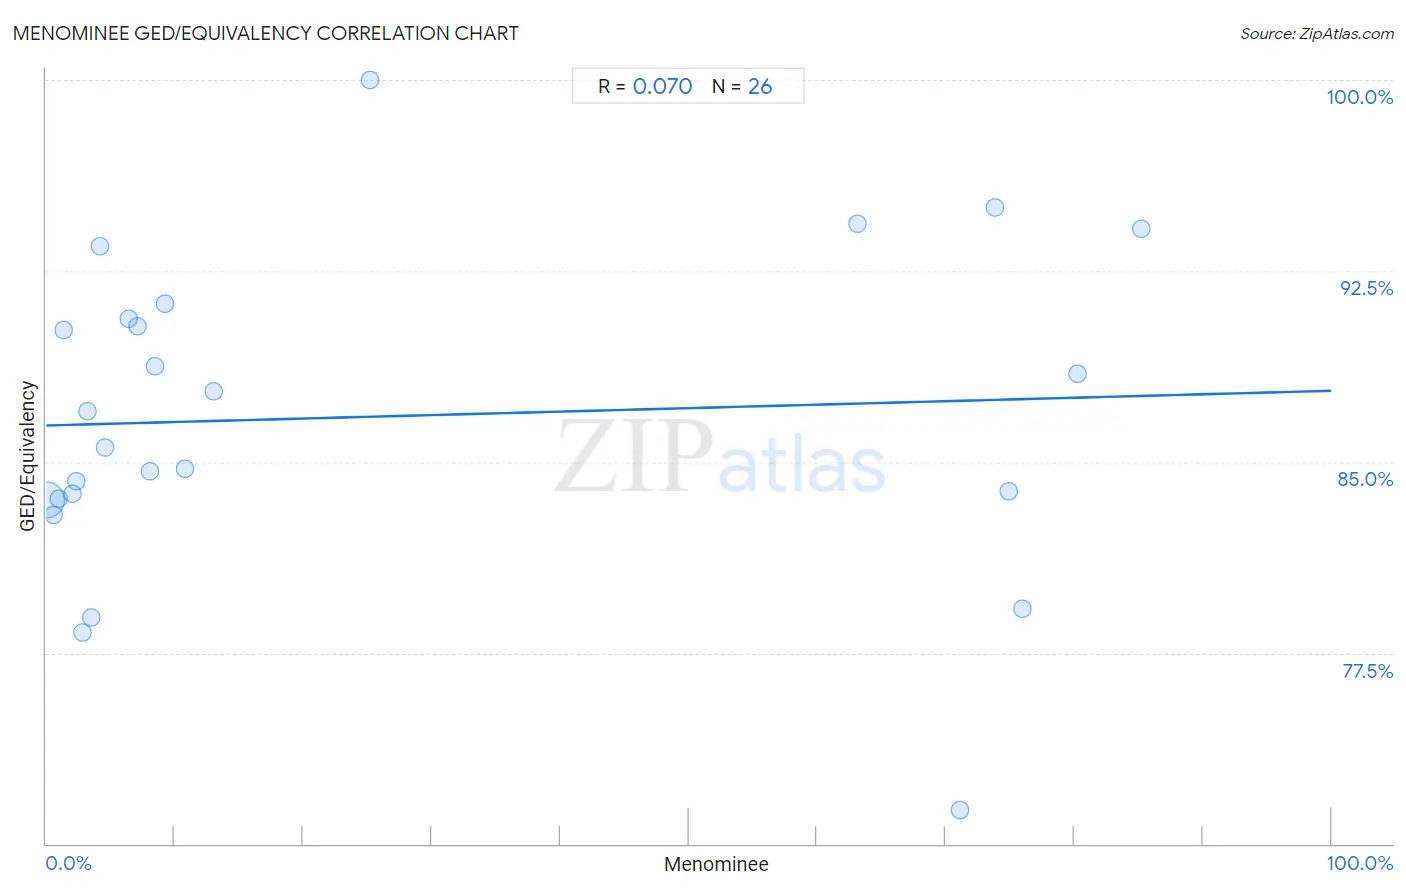
Menominee GED/Equivalency Correlation Chart

The statistical analysis conducted on geographies consisting of 45,778,979 people shows a slight positive correlation between the proportion of Menominee and percentage of population with at least ged/equivalency education in the United States with a correlation coefficient (R) of 0.070 and weighted average of 86.3%. On average, for every 1% (one percent) increase in Menominee within a typical geography, there is an increase of 0.014% in percentage of population with at least ged/equivalency education.
Menominee GED/Equivalency
It is essential to understand that the correlation between the percentage of Menominee and percentage of population with at least ged/equivalency education does not imply a direct cause-and-effect relationship. It remains uncertain whether the presence of Menominee influences an upward or downward trend in the level of percentage of population with at least ged/equivalency education within an area, or if Menominee simply ended up residing in those areas with higher or lower levels of percentage of population with at least ged/equivalency education due to other factors.

Demographics Similar to Menominee by GED/Equivalency

In terms of ged/equivalency, the demographic groups most similar to Menominee are Immigrants from Northern Africa (86.3%, a difference of 0.0%), Immigrants from Poland (86.3%, a difference of 0.0%), Basque (86.4%, a difference of 0.010%), Immigrants from Western Asia (86.3%, a difference of 0.010%), and Pakistani (86.4%, a difference of 0.040%).
DemographicsRating | RankGED/Equivalency
Immigrants from Indonesia
82.4
/100
|
#142
Excellent
86.4%
Immigrants from Pakistan
82.4
/100
|
#143
Excellent
86.4%
Bolivians
82.1
/100
|
#144
Excellent
86.4%
Pakistanis
80.4
/100
|
#145
Excellent
86.4%
Basques
79.5
/100
|
#146
Good
86.4%
Immigrants from Northern Africa
79.3
/100
|
#147
Good
86.3%
Immigrants from Poland
79.3
/100
|
#148
Good
86.3%
Menominee
79.3
/100
|
#149
Good
86.3%
Immigrants from Western Asia
78.8
/100
|
#150
Good
86.3%
Immigrants from Bosnia and Herzegovina
77.9
/100
|
#151
Good
86.3%
Brazilians
77.2
/100
|
#152
Good
86.3%
Kenyans
76.6
/100
|
#153
Good
86.3%
Armenians
76.4
/100
|
#154
Good
86.3%
Iraqis
75.2
/100
|
#155
Good
86.2%
Immigrants from Nepal
73.3
/100
|
#156
Good
86.2%

Menominee GED/Equivalency Correlation Summary

MeasurementMenominee DataGED/Equivalency Data
Minimum0.023%71.3%
Maximum85.2%100.0%
Range85.2%28.7%
Mean24.6%86.8%
Median7.6%86.3%
Interquartile 25% (IQ1)2.8%83.6%
Interquartile 75% (IQ3)63.1%90.6%
Interquartile Range (IQR)60.3%7.1%
Standard Deviation (Sample)31.8%6.2%
Standard Deviation (Population)31.1%6.1%

Correlation Details

Menominee PercentileSample SizeGED/Equivalency
[
0.0%
-
0.5%
]
0.023%
45,255,28883.5%
[
0.5%
-
1.0%
]
0.57%
288,30182.9%
[
0.5%
-
1.0%
]
1.00%
151,07983.6%
[
1.0%
-
1.5%
]
1.39%
27,37190.2%
[
2.0%
-
2.5%
]
2.02%
4,65683.8%
[
2.0%
-
2.5%
]
2.34%
1,83784.2%
[
2.5%
-
3.0%
]
2.84%
5,49578.3%
[
3.0%
-
3.5%
]
3.19%
3,13387.0%
[
3.0%
-
3.5%
]
3.46%
2,16578.9%
[
4.0%
-
4.5%
]
4.22%
52193.4%
[
4.5%
-
5.0%
]
4.62%
13085.6%
[
6.0%
-
6.5%
]
6.41%
23490.6%
[
7.0%
-
7.5%
]
7.08%
59390.3%
[
8.0%
-
8.5%
]
8.04%
1,60584.6%
[
8.0%
-
8.5%
]
8.48%
16,65788.8%
[
9.0%
-
9.5%
]
9.28%
2,10191.2%
[
10.5%
-
11.0%
]
10.77%
29784.7%
[
13.0%
-
13.5%
]
13.05%
9,21287.8%
[
25.0%
-
25.5%
]
25.21%
119100.0%
[
63.0%
-
63.5%
]
63.14%
1,53094.4%
[
71.0%
-
71.5%
]
71.10%
17371.3%
[
73.5%
-
74.0%
]
73.86%
3,05395.0%
[
74.5%
-
75.0%
]
74.87%
1,17083.9%
[
76.0%
-
76.5%
]
76.00%
15079.2%
[
80.0%
-
80.5%
]
80.29%
68588.5%
[
85.0%
-
85.5%
]
85.18%
1,42494.2%