Menominee 4 or more Vehicles in Household
COMPARE
Menominee
Select to Compare
4 or more Vehicles in Household
Menominee 4 or more Vehicles in Household
5.0%
4+ VEHICLES AVAILABLE
0.0/ 100
METRIC RATING
307th/ 347
METRIC RANK
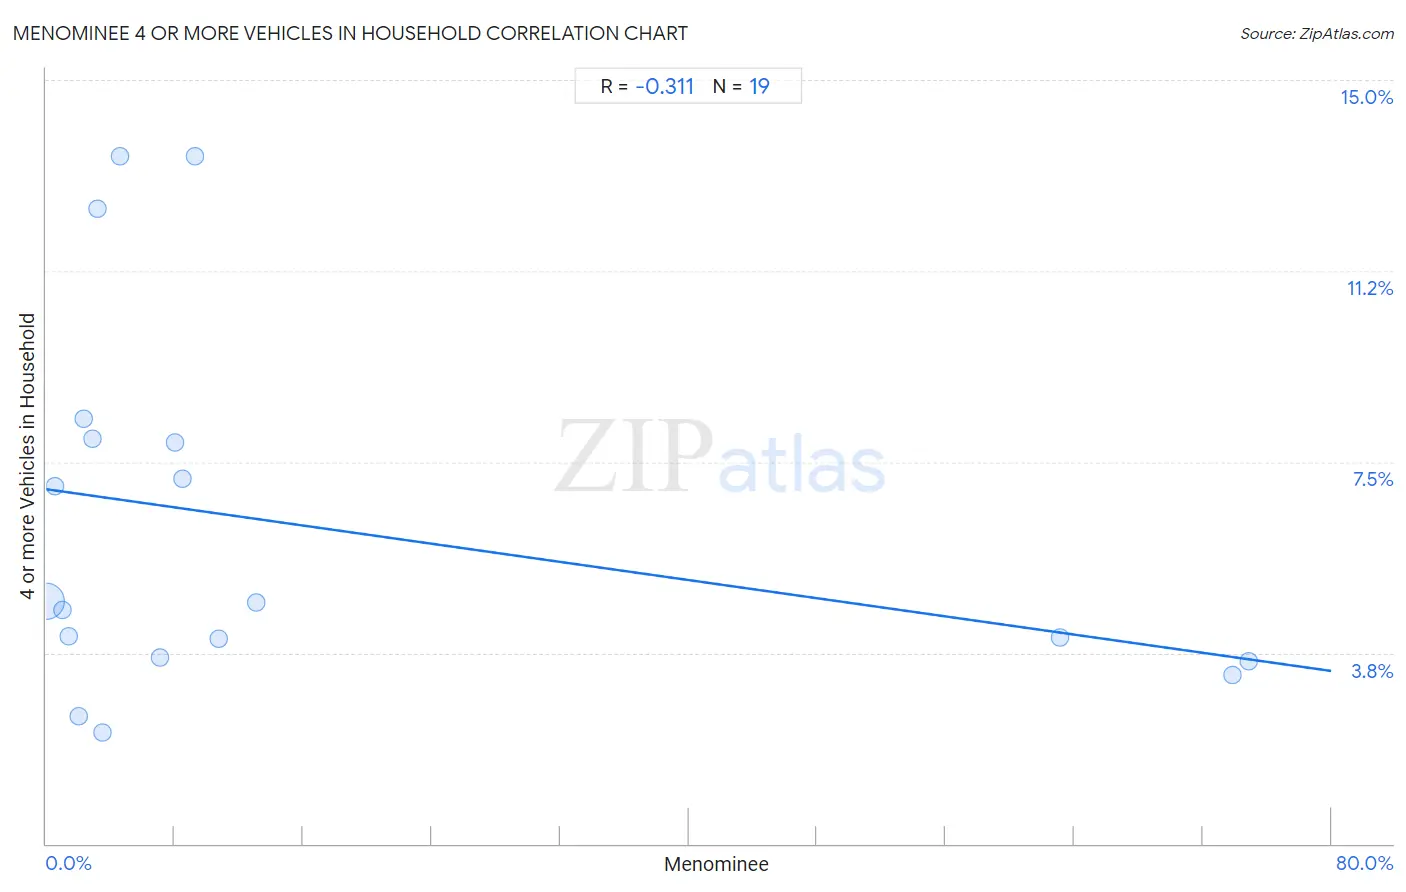
Menominee 4 or more Vehicles in Household Correlation Chart
The statistical analysis conducted on geographies consisting of 45,762,392 people shows a mild negative correlation between the proportion of Menominee and percentage of households with 4 or more vehicles available in the United States with a correlation coefficient (R) of -0.311 and weighted average of 5.0%. On average, for every 1% (one percent) increase in Menominee within a typical geography, there is a decrease of 0.045% in percentage of households with 4 or more vehicles available.
It is essential to understand that the correlation between the percentage of Menominee and percentage of households with 4 or more vehicles available does not imply a direct cause-and-effect relationship. It remains uncertain whether the presence of Menominee influences an upward or downward trend in the level of percentage of households with 4 or more vehicles available within an area, or if Menominee simply ended up residing in those areas with higher or lower levels of percentage of households with 4 or more vehicles available due to other factors.
Demographics Similar to Menominee by 4 or more Vehicles in Household
In terms of 4 or more vehicles in household, the demographic groups most similar to Menominee are Paraguayan (4.9%, a difference of 0.72%), Immigrants from Somalia (4.9%, a difference of 0.87%), Immigrants from Serbia (5.0%, a difference of 0.94%), Cypriot (5.0%, a difference of 1.0%), and Somali (5.0%, a difference of 1.0%).
| Demographics | Rating | Rank | 4 or more Vehicles in Household |
| Immigrants from Morocco | 0.0 /100 | #300 | Tragic 5.1% |
| Immigrants from Zaire | 0.0 /100 | #301 | Tragic 5.1% |
| Bahamians | 0.0 /100 | #302 | Tragic 5.1% |
| Immigrants from Greece | 0.0 /100 | #303 | Tragic 5.1% |
| Cypriots | 0.0 /100 | #304 | Tragic 5.0% |
| Somalis | 0.0 /100 | #305 | Tragic 5.0% |
| Immigrants from Serbia | 0.0 /100 | #306 | Tragic 5.0% |
| Menominee | 0.0 /100 | #307 | Tragic 5.0% |
| Paraguayans | 0.0 /100 | #308 | Tragic 4.9% |
| Immigrants from Somalia | 0.0 /100 | #309 | Tragic 4.9% |
| Moroccans | 0.0 /100 | #310 | Tragic 4.9% |
| Houma | 0.0 /100 | #311 | Tragic 4.9% |
| Albanians | 0.0 /100 | #312 | Tragic 4.8% |
| Immigrants from Israel | 0.0 /100 | #313 | Tragic 4.8% |
| Immigrants from West Indies | 0.0 /100 | #314 | Tragic 4.7% |
Menominee 4 or more Vehicles in Household Correlation Summary
| Measurement | Menominee Data | 4 or more Vehicles in Household Data |
| Minimum | 0.023% | 2.2% |
| Maximum | 74.9% | 13.5% |
| Range | 74.8% | 11.3% |
| Mean | 15.3% | 6.3% |
| Median | 4.6% | 4.7% |
| Interquartile 25% (IQ1) | 2.0% | 3.7% |
| Interquartile 75% (IQ3) | 10.8% | 7.9% |
| Interquartile Range (IQR) | 8.7% | 4.3% |
| Standard Deviation (Sample) | 25.0% | 3.6% |
| Standard Deviation (Population) | 24.3% | 3.5% |
Correlation Details
| Menominee Percentile | Sample Size | 4 or more Vehicles in Household |
[ 0.0% - 0.5% ] 0.023% | 45,243,249 | 4.8% |
[ 0.5% - 1.0% ] 0.57% | 288,301 | 7.0% |
[ 0.5% - 1.0% ] 1.00% | 151,079 | 4.6% |
[ 1.0% - 1.5% ] 1.39% | 27,371 | 4.1% |
[ 2.0% - 2.5% ] 2.02% | 4,544 | 2.5% |
[ 2.0% - 2.5% ] 2.34% | 1,837 | 8.3% |
[ 2.5% - 3.0% ] 2.89% | 4,365 | 7.9% |
[ 3.0% - 3.5% ] 3.19% | 3,133 | 12.5% |
[ 3.0% - 3.5% ] 3.46% | 2,165 | 2.2% |
[ 4.5% - 5.0% ] 4.62% | 130 | 13.5% |
[ 7.0% - 7.5% ] 7.08% | 593 | 3.7% |
[ 8.0% - 8.5% ] 8.04% | 1,605 | 7.9% |
[ 8.0% - 8.5% ] 8.48% | 16,657 | 7.2% |
[ 9.0% - 9.5% ] 9.28% | 2,101 | 13.5% |
[ 10.5% - 11.0% ] 10.77% | 297 | 4.0% |
[ 13.0% - 13.5% ] 13.05% | 9,212 | 4.7% |
[ 63.0% - 63.5% ] 63.14% | 1,530 | 4.1% |
[ 73.5% - 74.0% ] 73.86% | 3,053 | 3.3% |
[ 74.5% - 75.0% ] 74.87% | 1,170 | 3.6% |