Menominee College, 1 year or more
COMPARE
Menominee
Select to Compare
College, 1 year or more
Menominee College, 1 year or more
50.6%
COLLEGE, 1 YEAR OR MORE
0.0/ 100
METRIC RATING
327th/ 347
METRIC RANK
Menominee College, 1 year or more Correlation Chart
The statistical analysis conducted on geographies consisting of 45,778,860 people shows a weak negative correlation between the proportion of Menominee and percentage of population with at least college, 1 year or more education in the United States with a correlation coefficient (R) of -0.297 and weighted average of 50.6%. On average, for every 1% (one percent) increase in Menominee within a typical geography, there is a decrease of 0.090% in percentage of population with at least college, 1 year or more education.
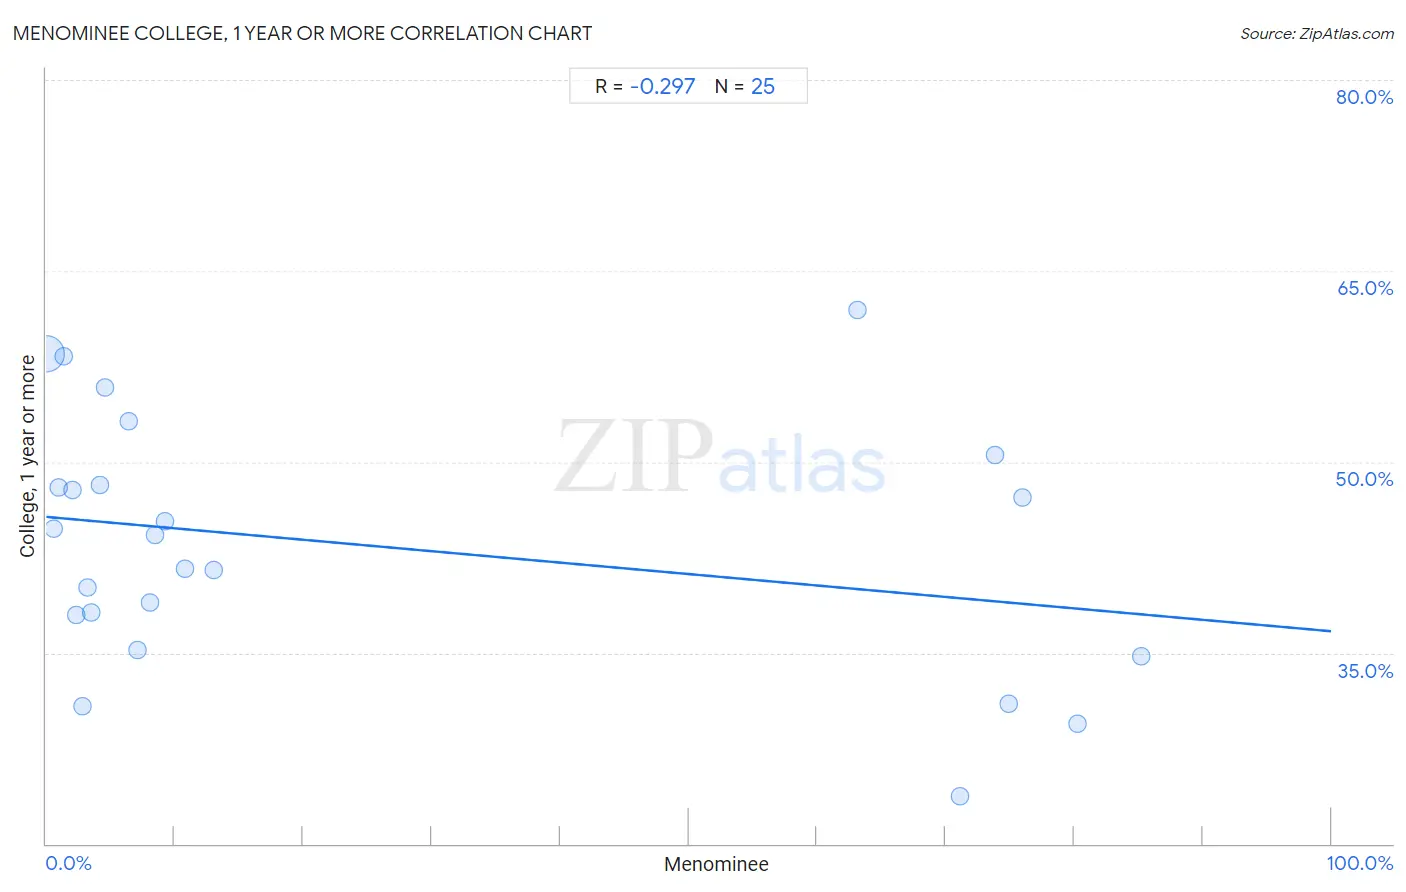
It is essential to understand that the correlation between the percentage of Menominee and percentage of population with at least college, 1 year or more education does not imply a direct cause-and-effect relationship. It remains uncertain whether the presence of Menominee influences an upward or downward trend in the level of percentage of population with at least college, 1 year or more education within an area, or if Menominee simply ended up residing in those areas with higher or lower levels of percentage of population with at least college, 1 year or more education due to other factors.
Demographics Similar to Menominee by College, 1 year or more
In terms of college, 1 year or more, the demographic groups most similar to Menominee are Dominican (50.6%, a difference of 0.040%), Dutch West Indian (50.5%, a difference of 0.12%), Immigrants from Latin America (50.7%, a difference of 0.22%), Immigrants from Cuba (50.7%, a difference of 0.25%), and Immigrants from Guatemala (50.7%, a difference of 0.26%).
| Demographics | Rating | Rank | College, 1 year or more |
| Kiowa | 0.0 /100 | #320 | Tragic 51.0% |
| Hopi | 0.0 /100 | #321 | Tragic 50.9% |
| Navajo | 0.0 /100 | #322 | Tragic 50.8% |
| Immigrants from Guatemala | 0.0 /100 | #323 | Tragic 50.7% |
| Immigrants from Cuba | 0.0 /100 | #324 | Tragic 50.7% |
| Immigrants from Latin America | 0.0 /100 | #325 | Tragic 50.7% |
| Dominicans | 0.0 /100 | #326 | Tragic 50.6% |
| Menominee | 0.0 /100 | #327 | Tragic 50.6% |
| Dutch West Indians | 0.0 /100 | #328 | Tragic 50.5% |
| Cape Verdeans | 0.0 /100 | #329 | Tragic 50.3% |
| Natives/Alaskans | 0.0 /100 | #330 | Tragic 50.2% |
| Immigrants from Yemen | 0.0 /100 | #331 | Tragic 50.0% |
| Mexicans | 0.0 /100 | #332 | Tragic 49.2% |
| Immigrants from Dominican Republic | 0.0 /100 | #333 | Tragic 49.1% |
| Lumbee | 0.0 /100 | #334 | Tragic 48.9% |
Menominee College, 1 year or more Correlation Summary
| Measurement | Menominee Data | College, 1 year or more Data |
| Minimum | 0.023% | 23.8% |
| Maximum | 85.2% | 61.9% |
| Range | 85.2% | 38.1% |
| Mean | 24.5% | 43.5% |
| Median | 7.1% | 44.3% |
| Interquartile 25% (IQ1) | 2.6% | 36.6% |
| Interquartile 75% (IQ3) | 67.1% | 49.3% |
| Interquartile Range (IQR) | 64.5% | 12.7% |
| Standard Deviation (Sample) | 32.4% | 9.8% |
| Standard Deviation (Population) | 31.8% | 9.6% |
Correlation Details
| Menominee Percentile | Sample Size | College, 1 year or more |
[ 0.0% - 0.5% ] 0.023% | 45,255,288 | 58.4% |
[ 0.5% - 1.0% ] 0.57% | 288,301 | 44.8% |
[ 0.5% - 1.0% ] 1.00% | 151,079 | 48.0% |
[ 1.0% - 1.5% ] 1.39% | 27,371 | 58.3% |
[ 2.0% - 2.5% ] 2.02% | 4,656 | 47.8% |
[ 2.0% - 2.5% ] 2.34% | 1,837 | 37.9% |
[ 2.5% - 3.0% ] 2.84% | 5,495 | 30.8% |
[ 3.0% - 3.5% ] 3.19% | 3,133 | 40.1% |
[ 3.0% - 3.5% ] 3.46% | 2,165 | 38.2% |
[ 4.0% - 4.5% ] 4.22% | 521 | 48.1% |
[ 4.5% - 5.0% ] 4.62% | 130 | 55.9% |
[ 6.0% - 6.5% ] 6.41% | 234 | 53.2% |
[ 7.0% - 7.5% ] 7.08% | 593 | 35.2% |
[ 8.0% - 8.5% ] 8.04% | 1,605 | 38.9% |
[ 8.0% - 8.5% ] 8.48% | 16,657 | 44.3% |
[ 9.0% - 9.5% ] 9.28% | 2,101 | 45.3% |
[ 10.5% - 11.0% ] 10.77% | 297 | 41.6% |
[ 13.0% - 13.5% ] 13.05% | 9,212 | 41.5% |
[ 63.0% - 63.5% ] 63.14% | 1,530 | 61.9% |
[ 71.0% - 71.5% ] 71.10% | 173 | 23.8% |
[ 73.5% - 74.0% ] 73.86% | 3,053 | 50.5% |
[ 74.5% - 75.0% ] 74.87% | 1,170 | 31.0% |
[ 76.0% - 76.5% ] 76.00% | 150 | 47.2% |
[ 80.0% - 80.5% ] 80.29% | 685 | 29.4% |
[ 85.0% - 85.5% ] 85.18% | 1,424 | 34.8% |