Menominee Married-couple Households
COMPARE
Menominee
Select to Compare
Married-couple Households
Menominee Married-couple Households
42.0%
MARRIED-COUPLE HOUSEHOLDS
0.0/ 100
METRIC RATING
293rd/ 347
METRIC RANK
Menominee Married-couple Households Correlation Chart
The statistical analysis conducted on geographies consisting of 45,777,849 people shows a poor positive correlation between the proportion of Menominee and percentage of married-couple family households in the United States with a correlation coefficient (R) of 0.110 and weighted average of 42.0%. On average, for every 1% (one percent) increase in Menominee within a typical geography, there is an increase of 0.043% in percentage of married-couple family households.
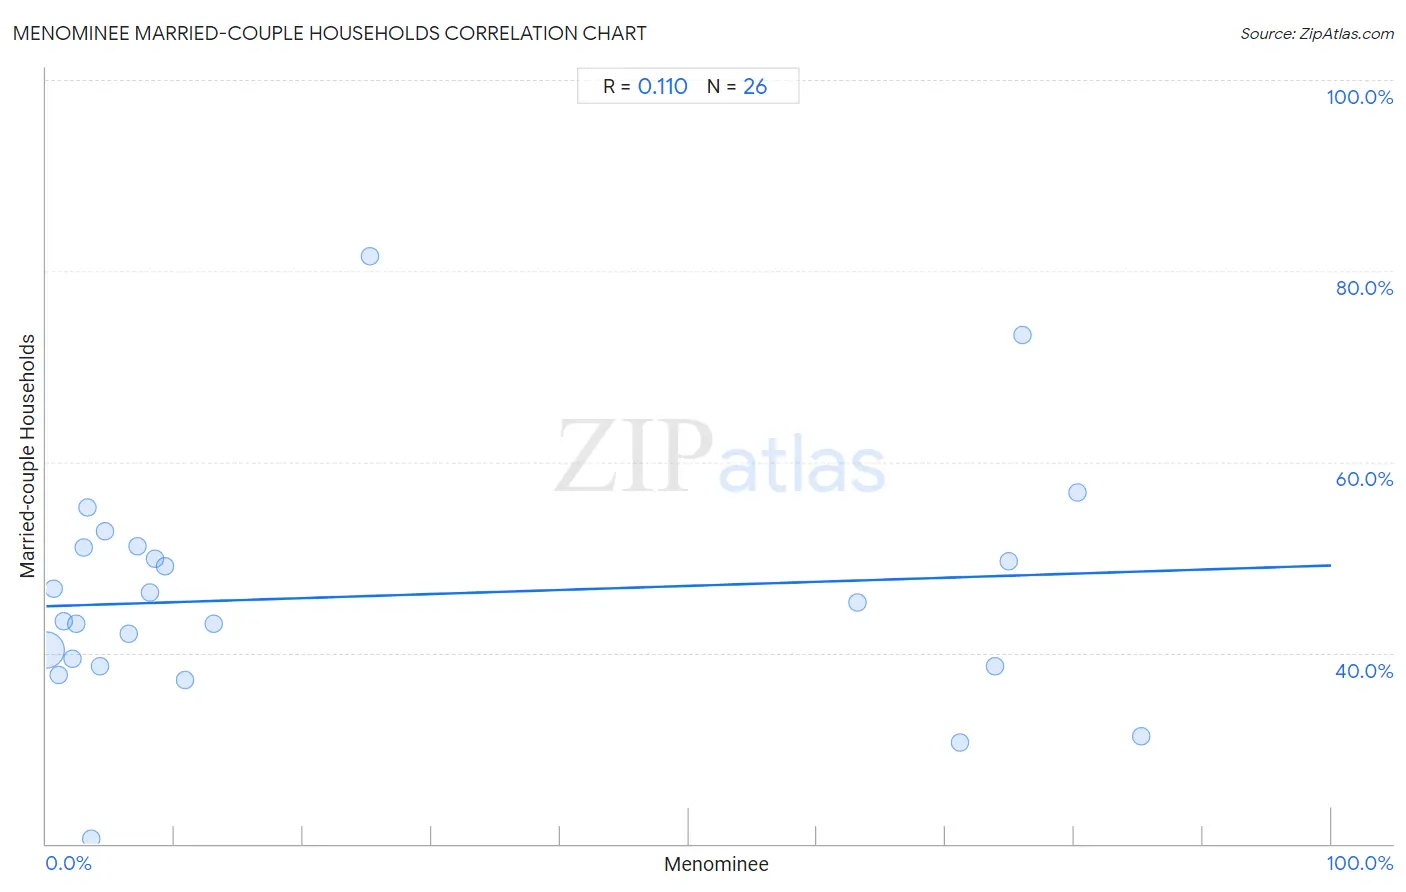
It is essential to understand that the correlation between the percentage of Menominee and percentage of married-couple family households does not imply a direct cause-and-effect relationship. It remains uncertain whether the presence of Menominee influences an upward or downward trend in the level of percentage of married-couple family households within an area, or if Menominee simply ended up residing in those areas with higher or lower levels of percentage of married-couple family households due to other factors.
Demographics Similar to Menominee by Married-couple Households
In terms of married-couple households, the demographic groups most similar to Menominee are Immigrants from Yemen (42.0%, a difference of 0.0%), Kiowa (42.0%, a difference of 0.0%), Indonesian (42.0%, a difference of 0.11%), Immigrants from Sudan (41.9%, a difference of 0.11%), and Paiute (42.1%, a difference of 0.16%).
| Demographics | Rating | Rank | Married-couple Households |
| Belizeans | 0.0 /100 | #286 | Tragic 42.2% |
| Chippewa | 0.0 /100 | #287 | Tragic 42.1% |
| Immigrants from Eritrea | 0.0 /100 | #288 | Tragic 42.1% |
| Sudanese | 0.0 /100 | #289 | Tragic 42.1% |
| Hondurans | 0.0 /100 | #290 | Tragic 42.1% |
| Paiute | 0.0 /100 | #291 | Tragic 42.1% |
| Indonesians | 0.0 /100 | #292 | Tragic 42.0% |
| Menominee | 0.0 /100 | #293 | Tragic 42.0% |
| Immigrants from Yemen | 0.0 /100 | #294 | Tragic 42.0% |
| Kiowa | 0.0 /100 | #295 | Tragic 42.0% |
| Immigrants from Sudan | 0.0 /100 | #296 | Tragic 41.9% |
| Arapaho | 0.0 /100 | #297 | Tragic 41.8% |
| Immigrants from Middle Africa | 0.0 /100 | #298 | Tragic 41.8% |
| Immigrants from Ghana | 0.0 /100 | #299 | Tragic 41.8% |
| Immigrants from Belize | 0.0 /100 | #300 | Tragic 41.8% |
Menominee Married-couple Households Correlation Summary
| Measurement | Menominee Data | Married-couple Households Data |
| Minimum | 0.023% | 20.5% |
| Maximum | 85.2% | 81.5% |
| Range | 85.2% | 61.0% |
| Mean | 24.6% | 45.9% |
| Median | 7.6% | 44.3% |
| Interquartile 25% (IQ1) | 2.9% | 38.6% |
| Interquartile 75% (IQ3) | 63.1% | 51.0% |
| Interquartile Range (IQR) | 60.3% | 12.4% |
| Standard Deviation (Sample) | 31.8% | 12.4% |
| Standard Deviation (Population) | 31.1% | 12.1% |
Correlation Details
| Menominee Percentile | Sample Size | Married-couple Households |
[ 0.0% - 0.5% ] 0.023% | 45,255,288 | 40.2% |
[ 0.5% - 1.0% ] 0.57% | 288,301 | 46.7% |
[ 0.5% - 1.0% ] 1.00% | 151,079 | 37.7% |
[ 1.0% - 1.5% ] 1.39% | 27,371 | 43.3% |
[ 2.0% - 2.5% ] 2.02% | 4,656 | 39.3% |
[ 2.0% - 2.5% ] 2.34% | 1,837 | 43.1% |
[ 2.5% - 3.0% ] 2.89% | 4,365 | 51.0% |
[ 3.0% - 3.5% ] 3.19% | 3,133 | 55.2% |
[ 3.0% - 3.5% ] 3.46% | 2,165 | 20.5% |
[ 4.0% - 4.5% ] 4.22% | 521 | 38.6% |
[ 4.5% - 5.0% ] 4.62% | 130 | 52.7% |
[ 6.0% - 6.5% ] 6.41% | 234 | 42.0% |
[ 7.0% - 7.5% ] 7.08% | 593 | 51.1% |
[ 8.0% - 8.5% ] 8.04% | 1,605 | 46.4% |
[ 8.0% - 8.5% ] 8.48% | 16,657 | 49.9% |
[ 9.0% - 9.5% ] 9.28% | 2,101 | 49.0% |
[ 10.5% - 11.0% ] 10.77% | 297 | 37.1% |
[ 13.0% - 13.5% ] 13.05% | 9,212 | 43.1% |
[ 25.0% - 25.5% ] 25.21% | 119 | 81.5% |
[ 63.0% - 63.5% ] 63.14% | 1,530 | 45.3% |
[ 71.0% - 71.5% ] 71.10% | 173 | 30.6% |
[ 73.5% - 74.0% ] 73.86% | 3,053 | 38.6% |
[ 74.5% - 75.0% ] 74.87% | 1,170 | 49.6% |
[ 76.0% - 76.5% ] 76.00% | 150 | 73.3% |
[ 80.0% - 80.5% ] 80.29% | 685 | 56.8% |
[ 85.0% - 85.5% ] 85.18% | 1,424 | 31.2% |