Indian (Asian) Disability Age Under 5
COMPARE
Indian (Asian)
Select to Compare
Disability Age Under 5
Indian (Asian) Disability Age Under 5
1.0%
DISABILITY | AGE UNDER 5
100.0/ 100
METRIC RATING
24th/ 347
METRIC RANK
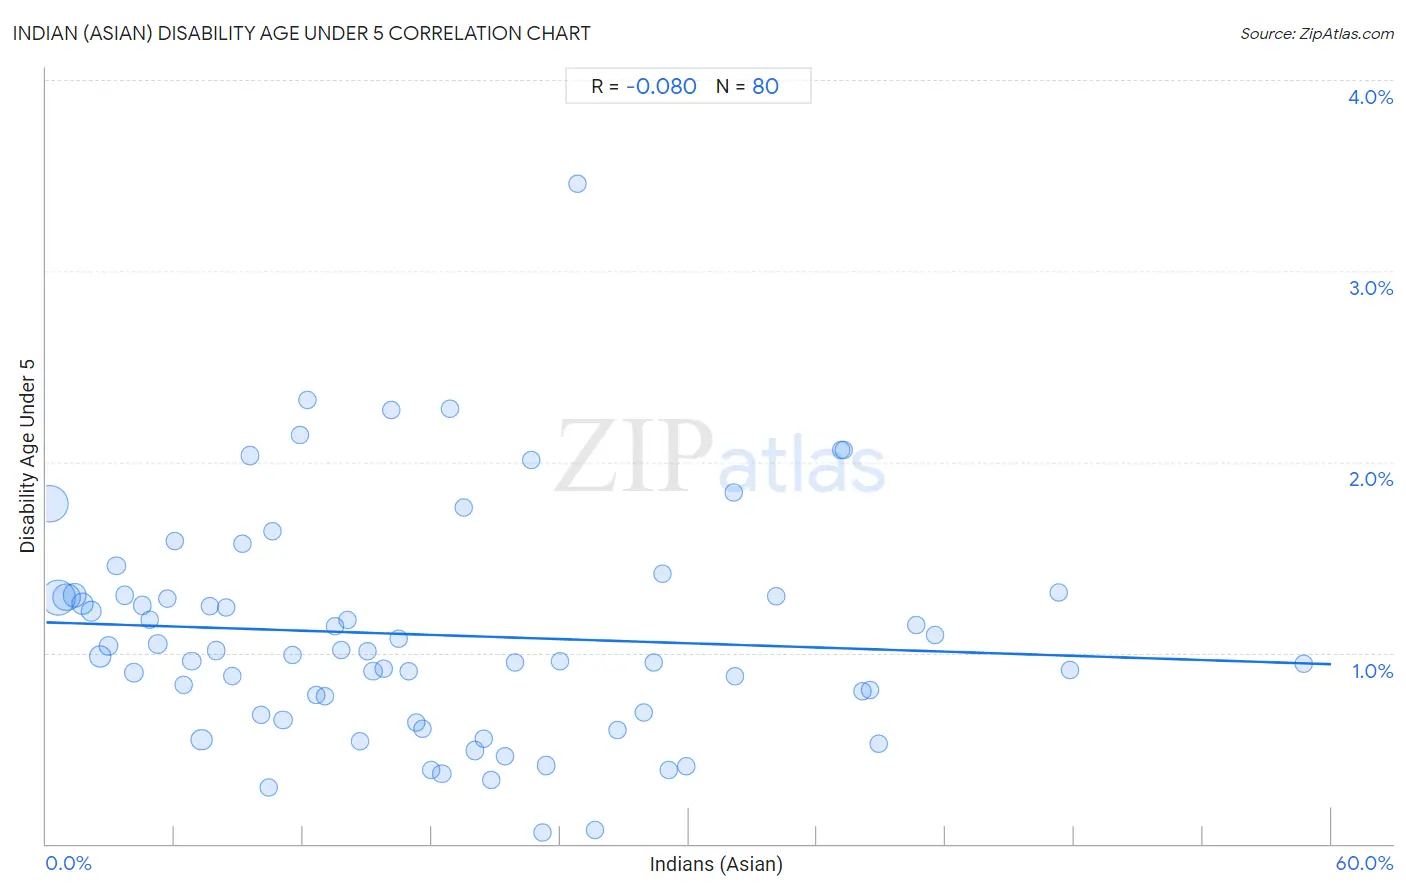
Indian (Asian) Disability Age Under 5 Correlation Chart
The statistical analysis conducted on geographies consisting of 247,409,982 people shows a slight negative correlation between the proportion of Indians (Asian) and percentage of population with a disability under the age of 5 in the United States with a correlation coefficient (R) of -0.080 and weighted average of 1.0%. On average, for every 1% (one percent) increase in Indians (Asian) within a typical geography, there is a decrease of 0.0037% in percentage of population with a disability under the age of 5.
It is essential to understand that the correlation between the percentage of Indians (Asian) and percentage of population with a disability under the age of 5 does not imply a direct cause-and-effect relationship. It remains uncertain whether the presence of Indians (Asian) influences an upward or downward trend in the level of percentage of population with a disability under the age of 5 within an area, or if Indians (Asian) simply ended up residing in those areas with higher or lower levels of percentage of population with a disability under the age of 5 due to other factors.
Demographics Similar to Indians (Asian) by Disability Age Under 5
In terms of disability age under 5, the demographic groups most similar to Indians (Asian) are Yakama (1.00%, a difference of 0.28%), Immigrants from Micronesia (1.0%, a difference of 0.31%), Immigrants from Iran (1.00%, a difference of 0.36%), Immigrants from Taiwan (1.0%, a difference of 0.43%), and British West Indian (0.99%, a difference of 1.1%).
| Demographics | Rating | Rank | Disability Age Under 5 |
| Immigrants from China | 100.0 /100 | #17 | Exceptional 0.96% |
| Immigrants from Barbados | 100.0 /100 | #18 | Exceptional 0.97% |
| Puget Sound Salish | 100.0 /100 | #19 | Exceptional 0.97% |
| Nepalese | 100.0 /100 | #20 | Exceptional 0.97% |
| British West Indians | 100.0 /100 | #21 | Exceptional 0.99% |
| Immigrants from Iran | 100.0 /100 | #22 | Exceptional 1.00% |
| Yakama | 100.0 /100 | #23 | Exceptional 1.00% |
| Indians (Asian) | 100.0 /100 | #24 | Exceptional 1.0% |
| Immigrants from Micronesia | 100.0 /100 | #25 | Exceptional 1.0% |
| Immigrants from Taiwan | 100.0 /100 | #26 | Exceptional 1.0% |
| Guyanese | 100.0 /100 | #27 | Exceptional 1.0% |
| Immigrants from Eastern Asia | 100.0 /100 | #28 | Exceptional 1.0% |
| Immigrants from Belarus | 100.0 /100 | #29 | Exceptional 1.0% |
| Immigrants from South Central Asia | 99.9 /100 | #30 | Exceptional 1.0% |
| Armenians | 99.9 /100 | #31 | Exceptional 1.0% |
Indian (Asian) Disability Age Under 5 Correlation Summary
| Measurement | Indian (Asian) Data | Disability Age Under 5 Data |
| Minimum | 0.20% | 0.058% |
| Maximum | 58.7% | 3.5% |
| Range | 58.5% | 3.4% |
| Mean | 17.9% | 1.1% |
| Median | 15.5% | 1.0% |
| Interquartile 25% (IQ1) | 7.8% | 0.68% |
| Interquartile 75% (IQ3) | 25.2% | 1.3% |
| Interquartile Range (IQR) | 17.4% | 0.62% |
| Standard Deviation (Sample) | 12.9% | 0.59% |
| Standard Deviation (Population) | 12.8% | 0.59% |
Correlation Details
| Indian (Asian) Percentile | Sample Size | Disability Age Under 5 |
[ 0.0% - 0.5% ] 0.20% | 62,189,501 | 1.8% |
[ 0.5% - 1.0% ] 0.57% | 56,979,150 | 1.3% |
[ 0.5% - 1.0% ] 0.95% | 31,066,957 | 1.3% |
[ 1.0% - 1.5% ] 1.34% | 18,453,174 | 1.3% |
[ 1.5% - 2.0% ] 1.71% | 12,725,600 | 1.3% |
[ 2.0% - 2.5% ] 2.09% | 8,439,575 | 1.2% |
[ 2.5% - 3.0% ] 2.52% | 11,000,685 | 0.98% |
[ 2.5% - 3.0% ] 2.91% | 6,021,467 | 1.0% |
[ 3.0% - 3.5% ] 3.29% | 3,037,320 | 1.5% |
[ 3.5% - 4.0% ] 3.65% | 2,157,432 | 1.3% |
[ 4.0% - 4.5% ] 4.09% | 3,095,838 | 0.90% |
[ 4.0% - 4.5% ] 4.47% | 1,336,785 | 1.2% |
[ 4.5% - 5.0% ] 4.83% | 1,778,656 | 1.2% |
[ 5.0% - 5.5% ] 5.20% | 2,395,040 | 1.0% |
[ 5.5% - 6.0% ] 5.66% | 1,083,666 | 1.3% |
[ 6.0% - 6.5% ] 6.01% | 1,275,422 | 1.6% |
[ 6.0% - 6.5% ] 6.44% | 666,283 | 0.83% |
[ 6.5% - 7.0% ] 6.79% | 917,685 | 0.96% |
[ 7.0% - 7.5% ] 7.26% | 10,215,703 | 0.54% |
[ 7.5% - 8.0% ] 7.63% | 592,084 | 1.2% |
[ 7.5% - 8.0% ] 7.95% | 434,542 | 1.0% |
[ 8.0% - 8.5% ] 8.39% | 435,953 | 1.2% |
[ 8.5% - 9.0% ] 8.69% | 1,268,545 | 0.88% |
[ 9.0% - 9.5% ] 9.16% | 243,892 | 1.6% |
[ 9.5% - 10.0% ] 9.51% | 218,318 | 2.0% |
[ 10.0% - 10.5% ] 10.02% | 1,108,898 | 0.67% |
[ 10.0% - 10.5% ] 10.41% | 52,495 | 0.29% |
[ 10.5% - 11.0% ] 10.59% | 197,443 | 1.6% |
[ 11.0% - 11.5% ] 11.06% | 335,731 | 0.65% |
[ 11.0% - 11.5% ] 11.50% | 205,142 | 0.99% |
[ 11.5% - 12.0% ] 11.88% | 189,243 | 2.1% |
[ 12.0% - 12.5% ] 12.19% | 299,294 | 2.3% |
[ 12.5% - 13.0% ] 12.58% | 199,879 | 0.78% |
[ 13.0% - 13.5% ] 13.02% | 307,821 | 0.77% |
[ 13.0% - 13.5% ] 13.48% | 122,353 | 1.1% |
[ 13.5% - 14.0% ] 13.79% | 201,517 | 1.0% |
[ 14.0% - 14.5% ] 14.07% | 248,898 | 1.2% |
[ 14.5% - 15.0% ] 14.63% | 70,773 | 0.54% |
[ 14.5% - 15.0% ] 14.97% | 72,861 | 1.0% |
[ 15.0% - 15.5% ] 15.26% | 482,433 | 0.91% |
[ 15.5% - 16.0% ] 15.75% | 228,245 | 0.92% |
[ 16.0% - 16.5% ] 16.09% | 124,590 | 2.3% |
[ 16.0% - 16.5% ] 16.43% | 301,714 | 1.1% |
[ 16.5% - 17.0% ] 16.92% | 272,761 | 0.90% |
[ 17.0% - 17.5% ] 17.28% | 28,201 | 0.64% |
[ 17.5% - 18.0% ] 17.55% | 151,968 | 0.60% |
[ 17.5% - 18.0% ] 17.95% | 438,312 | 0.39% |
[ 18.0% - 18.5% ] 18.47% | 430,995 | 0.37% |
[ 18.5% - 19.0% ] 18.87% | 152,262 | 2.3% |
[ 19.0% - 19.5% ] 19.50% | 21,546 | 1.8% |
[ 20.0% - 20.5% ] 20.03% | 552,997 | 0.49% |
[ 20.0% - 20.5% ] 20.43% | 104,685 | 0.55% |
[ 20.5% - 21.0% ] 20.77% | 184,537 | 0.34% |
[ 21.0% - 21.5% ] 21.41% | 123,789 | 0.46% |
[ 21.5% - 22.0% ] 21.86% | 35,493 | 0.95% |
[ 22.5% - 23.0% ] 22.64% | 22,701 | 2.0% |
[ 23.0% - 23.5% ] 23.19% | 29,544 | 0.058% |
[ 23.0% - 23.5% ] 23.36% | 851,036 | 0.41% |
[ 23.5% - 24.0% ] 23.98% | 27,785 | 0.95% |
[ 24.5% - 25.0% ] 24.79% | 14,281 | 3.5% |
[ 25.5% - 26.0% ] 25.60% | 80,575 | 0.069% |
[ 26.5% - 27.0% ] 26.67% | 37,647 | 0.59% |
[ 27.5% - 28.0% ] 27.90% | 110,950 | 0.69% |
[ 28.0% - 28.5% ] 28.38% | 37,347 | 0.95% |
[ 28.5% - 29.0% ] 28.77% | 46,424 | 1.4% |
[ 29.0% - 29.5% ] 29.07% | 61,414 | 0.38% |
[ 29.5% - 30.0% ] 29.88% | 59,763 | 0.40% |
[ 32.0% - 32.5% ] 32.10% | 38,124 | 1.8% |
[ 32.0% - 32.5% ] 32.19% | 44,196 | 0.88% |
[ 34.0% - 34.5% ] 34.08% | 59,453 | 1.3% |
[ 37.0% - 37.5% ] 37.09% | 37,423 | 2.1% |
[ 37.0% - 37.5% ] 37.23% | 33,367 | 2.1% |
[ 38.0% - 38.5% ] 38.11% | 129,504 | 0.80% |
[ 38.0% - 38.5% ] 38.47% | 53,320 | 0.80% |
[ 38.5% - 39.0% ] 38.86% | 85,228 | 0.53% |
[ 40.5% - 41.0% ] 40.62% | 28,212 | 1.1% |
[ 41.5% - 42.0% ] 41.51% | 33,937 | 1.1% |
[ 47.0% - 47.5% ] 47.26% | 36,165 | 1.3% |
[ 47.5% - 48.0% ] 47.80% | 95,942 | 0.91% |
[ 58.5% - 59.0% ] 58.72% | 79,495 | 0.94% |