Indian (Asian) College, Under 1 year
COMPARE
Indian (Asian)
Select to Compare
College, Under 1 year
Indian (Asian) College, Under 1 year
70.8%
COLLEGE, UNDER 1 YEAR
99.9/ 100
METRIC RATING
31st/ 347
METRIC RANK
Indian (Asian) College, Under 1 year Correlation Chart
The statistical analysis conducted on geographies consisting of 495,343,184 people shows a mild negative correlation between the proportion of Indians (Asian) and percentage of population with at least college, under 1 year education in the United States with a correlation coefficient (R) of -0.307 and weighted average of 70.8%. On average, for every 1% (one percent) increase in Indians (Asian) within a typical geography, there is a decrease of 0.21% in percentage of population with at least college, under 1 year education.
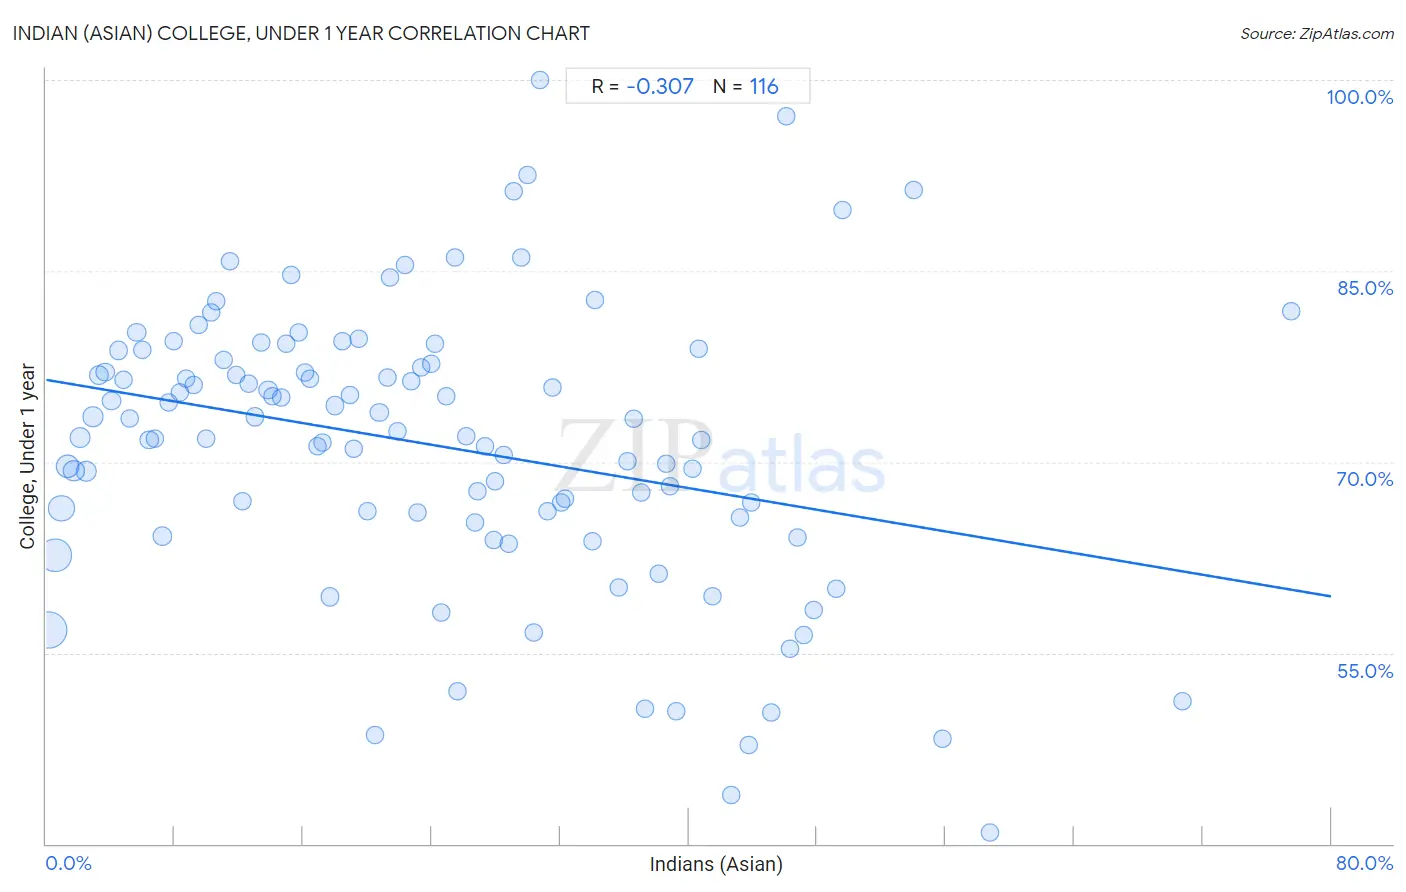
It is essential to understand that the correlation between the percentage of Indians (Asian) and percentage of population with at least college, under 1 year education does not imply a direct cause-and-effect relationship. It remains uncertain whether the presence of Indians (Asian) influences an upward or downward trend in the level of percentage of population with at least college, under 1 year education within an area, or if Indians (Asian) simply ended up residing in those areas with higher or lower levels of percentage of population with at least college, under 1 year education due to other factors.
Demographics Similar to Indians (Asian) by College, Under 1 year
In terms of college, under 1 year, the demographic groups most similar to Indians (Asian) are Turkish (70.7%, a difference of 0.080%), Immigrants from China (70.9%, a difference of 0.11%), Immigrants from South Africa (70.6%, a difference of 0.25%), Estonian (70.6%, a difference of 0.27%), and Immigrants from Hong Kong (71.0%, a difference of 0.29%).
| Demographics | Rating | Rank | College, Under 1 year |
| Soviet Union | 100.0 /100 | #24 | Exceptional 71.1% |
| Bulgarians | 100.0 /100 | #25 | Exceptional 71.1% |
| Immigrants from Denmark | 100.0 /100 | #26 | Exceptional 71.0% |
| Immigrants from Ireland | 100.0 /100 | #27 | Exceptional 71.0% |
| Immigrants from Hong Kong | 100.0 /100 | #28 | Exceptional 71.0% |
| Immigrants from France | 100.0 /100 | #29 | Exceptional 71.0% |
| Immigrants from China | 99.9 /100 | #30 | Exceptional 70.9% |
| Indians (Asian) | 99.9 /100 | #31 | Exceptional 70.8% |
| Turks | 99.9 /100 | #32 | Exceptional 70.7% |
| Immigrants from South Africa | 99.9 /100 | #33 | Exceptional 70.6% |
| Estonians | 99.9 /100 | #34 | Exceptional 70.6% |
| Russians | 99.9 /100 | #35 | Exceptional 70.5% |
| Immigrants from Sri Lanka | 99.9 /100 | #36 | Exceptional 70.5% |
| Immigrants from Saudi Arabia | 99.9 /100 | #37 | Exceptional 70.4% |
| Australians | 99.9 /100 | #38 | Exceptional 70.4% |
Indian (Asian) College, Under 1 year Correlation Summary
| Measurement | Indian (Asian) Data | College, Under 1 year Data |
| Minimum | 0.19% | 40.9% |
| Maximum | 77.5% | 100.0% |
| Range | 77.3% | 59.1% |
| Mean | 24.2% | 71.3% |
| Median | 22.5% | 72.2% |
| Interquartile 25% (IQ1) | 11.2% | 65.9% |
| Interquartile 75% (IQ3) | 35.9% | 77.9% |
| Interquartile Range (IQR) | 24.7% | 12.0% |
| Standard Deviation (Sample) | 16.0% | 11.1% |
| Standard Deviation (Population) | 15.9% | 11.0% |
Correlation Details
| Indian (Asian) Percentile | Sample Size | College, Under 1 year |
[ 0.0% - 0.5% ] 0.19% | 140,561,541 | 56.8% |
[ 0.5% - 1.0% ] 0.57% | 108,237,380 | 62.7% |
[ 0.5% - 1.0% ] 0.95% | 62,764,519 | 66.4% |
[ 1.0% - 1.5% ] 1.34% | 36,257,452 | 69.7% |
[ 1.5% - 2.0% ] 1.72% | 25,922,857 | 69.3% |
[ 2.0% - 2.5% ] 2.11% | 17,553,877 | 71.9% |
[ 2.5% - 3.0% ] 2.51% | 18,130,445 | 69.3% |
[ 2.5% - 3.0% ] 2.91% | 11,458,885 | 73.5% |
[ 3.0% - 3.5% ] 3.29% | 6,945,652 | 76.8% |
[ 3.5% - 4.0% ] 3.67% | 5,999,229 | 77.1% |
[ 4.0% - 4.5% ] 4.08% | 5,832,252 | 74.8% |
[ 4.0% - 4.5% ] 4.48% | 3,419,938 | 78.7% |
[ 4.5% - 5.0% ] 4.83% | 3,318,426 | 76.4% |
[ 5.0% - 5.5% ] 5.22% | 4,126,302 | 73.4% |
[ 5.5% - 6.0% ] 5.64% | 2,350,908 | 80.2% |
[ 5.5% - 6.0% ] 6.00% | 2,250,492 | 78.8% |
[ 6.0% - 6.5% ] 6.42% | 1,657,775 | 71.7% |
[ 6.5% - 7.0% ] 6.77% | 1,862,092 | 71.8% |
[ 7.0% - 7.5% ] 7.25% | 10,880,014 | 64.1% |
[ 7.5% - 8.0% ] 7.61% | 1,075,295 | 74.6% |
[ 7.5% - 8.0% ] 7.95% | 1,304,333 | 79.5% |
[ 8.0% - 8.5% ] 8.35% | 1,285,701 | 75.5% |
[ 8.5% - 9.0% ] 8.71% | 1,914,207 | 76.5% |
[ 9.0% - 9.5% ] 9.15% | 717,546 | 76.1% |
[ 9.5% - 10.0% ] 9.51% | 777,845 | 80.7% |
[ 9.5% - 10.0% ] 9.98% | 1,478,011 | 71.8% |
[ 10.0% - 10.5% ] 10.30% | 438,604 | 81.7% |
[ 10.5% - 11.0% ] 10.62% | 419,481 | 82.6% |
[ 11.0% - 11.5% ] 11.04% | 694,909 | 78.0% |
[ 11.0% - 11.5% ] 11.44% | 568,984 | 85.8% |
[ 11.5% - 12.0% ] 11.84% | 714,372 | 76.8% |
[ 12.0% - 12.5% ] 12.19% | 770,160 | 67.0% |
[ 12.5% - 13.0% ] 12.63% | 681,596 | 76.1% |
[ 13.0% - 13.5% ] 13.00% | 446,244 | 73.5% |
[ 13.0% - 13.5% ] 13.42% | 232,795 | 79.4% |
[ 13.5% - 14.0% ] 13.81% | 339,373 | 75.6% |
[ 14.0% - 14.5% ] 14.09% | 552,650 | 75.2% |
[ 14.5% - 15.0% ] 14.59% | 202,223 | 75.0% |
[ 14.5% - 15.0% ] 14.93% | 470,981 | 79.3% |
[ 15.0% - 15.5% ] 15.27% | 749,333 | 84.7% |
[ 15.5% - 16.0% ] 15.71% | 465,405 | 80.2% |
[ 16.0% - 16.5% ] 16.08% | 276,336 | 77.0% |
[ 16.0% - 16.5% ] 16.40% | 515,007 | 76.5% |
[ 16.5% - 17.0% ] 16.89% | 420,482 | 71.3% |
[ 17.0% - 17.5% ] 17.21% | 102,809 | 71.5% |
[ 17.5% - 18.0% ] 17.63% | 334,774 | 59.4% |
[ 17.5% - 18.0% ] 17.97% | 641,695 | 74.4% |
[ 18.0% - 18.5% ] 18.43% | 527,602 | 79.5% |
[ 18.5% - 19.0% ] 18.87% | 338,579 | 75.2% |
[ 19.0% - 19.5% ] 19.11% | 119,017 | 71.1% |
[ 19.0% - 19.5% ] 19.48% | 319,065 | 79.7% |
[ 20.0% - 20.5% ] 20.02% | 795,534 | 66.2% |
[ 20.0% - 20.5% ] 20.43% | 107,024 | 48.5% |
[ 20.5% - 21.0% ] 20.74% | 236,857 | 73.9% |
[ 21.0% - 21.5% ] 21.21% | 68,874 | 76.6% |
[ 21.0% - 21.5% ] 21.41% | 203,886 | 84.5% |
[ 21.5% - 22.0% ] 21.85% | 64,946 | 72.4% |
[ 22.0% - 22.5% ] 22.30% | 76,137 | 85.5% |
[ 22.5% - 23.0% ] 22.71% | 133,398 | 76.4% |
[ 23.0% - 23.5% ] 23.09% | 144,601 | 66.1% |
[ 23.0% - 23.5% ] 23.36% | 862,624 | 77.4% |
[ 23.5% - 24.0% ] 23.95% | 60,815 | 77.7% |
[ 24.0% - 24.5% ] 24.23% | 181,482 | 79.3% |
[ 24.5% - 25.0% ] 24.58% | 45,466 | 58.2% |
[ 24.5% - 25.0% ] 24.93% | 8,755 | 75.2% |
[ 25.0% - 25.5% ] 25.46% | 58,529 | 86.1% |
[ 25.5% - 26.0% ] 25.62% | 91,833 | 52.0% |
[ 26.0% - 26.5% ] 26.11% | 23,343 | 72.0% |
[ 26.5% - 27.0% ] 26.68% | 52,159 | 65.2% |
[ 26.5% - 27.0% ] 26.85% | 88,531 | 67.7% |
[ 27.0% - 27.5% ] 27.32% | 29,394 | 71.3% |
[ 27.5% - 28.0% ] 27.87% | 125,567 | 63.9% |
[ 27.5% - 28.0% ] 27.93% | 52,707 | 68.4% |
[ 28.0% - 28.5% ] 28.48% | 108,626 | 70.6% |
[ 28.5% - 29.0% ] 28.77% | 46,424 | 63.6% |
[ 29.0% - 29.5% ] 29.13% | 128,689 | 91.2% |
[ 29.5% - 30.0% ] 29.57% | 90,121 | 86.1% |
[ 29.5% - 30.0% ] 29.99% | 90,534 | 92.5% |
[ 30.0% - 30.5% ] 30.34% | 118,437 | 56.6% |
[ 30.5% - 31.0% ] 30.73% | 192 | 100.0% |
[ 31.0% - 31.5% ] 31.18% | 19,928 | 66.1% |
[ 31.5% - 32.0% ] 31.53% | 48,930 | 75.8% |
[ 32.0% - 32.5% ] 32.10% | 38,554 | 66.8% |
[ 32.0% - 32.5% ] 32.32% | 98,730 | 67.1% |
[ 34.0% - 34.5% ] 34.02% | 135,971 | 63.8% |
[ 34.0% - 34.5% ] 34.14% | 43,304 | 82.7% |
[ 35.5% - 36.0% ] 35.63% | 80,880 | 60.1% |
[ 36.0% - 36.5% ] 36.18% | 65,922 | 70.0% |
[ 36.5% - 37.0% ] 36.54% | 31,986 | 73.4% |
[ 37.0% - 37.5% ] 37.05% | 62,692 | 67.6% |
[ 37.0% - 37.5% ] 37.29% | 141,083 | 50.6% |
[ 38.0% - 38.5% ] 38.11% | 129,504 | 61.3% |
[ 38.5% - 39.0% ] 38.57% | 115,076 | 69.9% |
[ 38.5% - 39.0% ] 38.86% | 85,525 | 68.1% |
[ 39.0% - 39.5% ] 39.20% | 7,786 | 50.4% |
[ 40.0% - 40.5% ] 40.23% | 23,014 | 69.5% |
[ 40.5% - 41.0% ] 40.62% | 28,212 | 78.9% |
[ 40.5% - 41.0% ] 40.74% | 2,852 | 71.7% |
[ 41.5% - 42.0% ] 41.51% | 33,937 | 59.4% |
[ 42.5% - 43.0% ] 42.62% | 60,364 | 43.8% |
[ 43.0% - 43.5% ] 43.21% | 83,114 | 65.6% |
[ 43.5% - 44.0% ] 43.76% | 91,781 | 47.8% |
[ 43.5% - 44.0% ] 43.92% | 25,460 | 66.9% |
[ 45.0% - 45.5% ] 45.16% | 37,340 | 50.3% |
[ 46.0% - 46.5% ] 46.03% | 63 | 97.1% |
[ 46.0% - 46.5% ] 46.32% | 557 | 55.3% |
[ 46.5% - 47.0% ] 46.81% | 329 | 64.1% |
[ 47.0% - 47.5% ] 47.13% | 89,536 | 56.4% |
[ 47.5% - 48.0% ] 47.81% | 96,393 | 58.4% |
[ 49.0% - 49.5% ] 49.15% | 12,070 | 60.0% |
[ 49.5% - 50.0% ] 49.57% | 117 | 89.8% |
[ 54.0% - 54.5% ] 54.04% | 25,001 | 91.3% |
[ 55.5% - 56.0% ] 55.81% | 26,418 | 48.2% |
[ 58.5% - 59.0% ] 58.72% | 79,495 | 40.9% |
[ 70.5% - 71.0% ] 70.75% | 147 | 51.2% |
[ 77.5% - 78.0% ] 77.53% | 178 | 81.8% |