Indian (Asian) Married-couple Households
COMPARE
Indian (Asian)
Select to Compare
Married-couple Households
Indian (Asian) Married-couple Households
48.7%
MARRIED-COUPLE HOUSEHOLDS
99.4/ 100
METRIC RATING
48th/ 347
METRIC RANK
Indian (Asian) Married-couple Households Correlation Chart
The statistical analysis conducted on geographies consisting of 494,754,357 people shows a slight positive correlation between the proportion of Indians (Asian) and percentage of married-couple family households in the United States with a correlation coefficient (R) of 0.099 and weighted average of 48.7%. On average, for every 1% (one percent) increase in Indians (Asian) within a typical geography, there is an increase of 0.061% in percentage of married-couple family households.
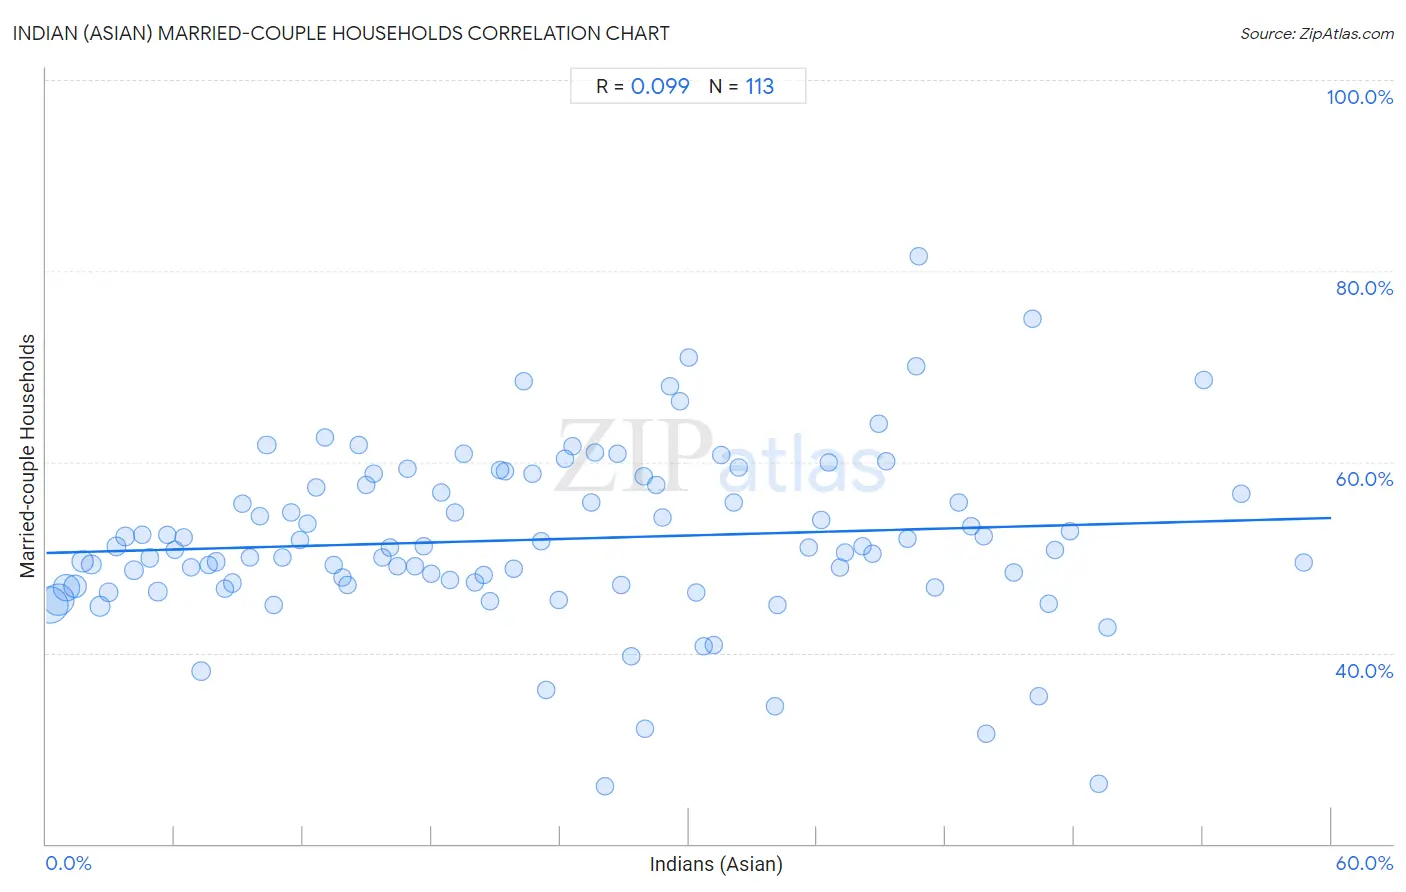
It is essential to understand that the correlation between the percentage of Indians (Asian) and percentage of married-couple family households does not imply a direct cause-and-effect relationship. It remains uncertain whether the presence of Indians (Asian) influences an upward or downward trend in the level of percentage of married-couple family households within an area, or if Indians (Asian) simply ended up residing in those areas with higher or lower levels of percentage of married-couple family households due to other factors.
Demographics Similar to Indians (Asian) by Married-couple Households
In terms of married-couple households, the demographic groups most similar to Indians (Asian) are British (48.7%, a difference of 0.050%), Immigrants from Sri Lanka (48.7%, a difference of 0.060%), Tsimshian (48.7%, a difference of 0.070%), Samoan (48.7%, a difference of 0.10%), and Immigrants from Eastern Asia (48.8%, a difference of 0.12%).
| Demographics | Rating | Rank | Married-couple Households |
| Immigrants from Lebanon | 99.6 /100 | #41 | Exceptional 48.9% |
| Immigrants from Vietnam | 99.6 /100 | #42 | Exceptional 48.8% |
| Immigrants from Iran | 99.6 /100 | #43 | Exceptional 48.8% |
| Welsh | 99.5 /100 | #44 | Exceptional 48.8% |
| Immigrants from Eastern Asia | 99.5 /100 | #45 | Exceptional 48.8% |
| Tsimshian | 99.5 /100 | #46 | Exceptional 48.7% |
| British | 99.5 /100 | #47 | Exceptional 48.7% |
| Indians (Asian) | 99.4 /100 | #48 | Exceptional 48.7% |
| Immigrants from Sri Lanka | 99.4 /100 | #49 | Exceptional 48.7% |
| Samoans | 99.4 /100 | #50 | Exceptional 48.7% |
| Eastern Europeans | 99.3 /100 | #51 | Exceptional 48.6% |
| Irish | 99.3 /100 | #52 | Exceptional 48.6% |
| Whites/Caucasians | 99.3 /100 | #53 | Exceptional 48.6% |
| Immigrants from Lithuania | 99.3 /100 | #54 | Exceptional 48.6% |
| Austrians | 99.3 /100 | #55 | Exceptional 48.6% |
Indian (Asian) Married-couple Households Correlation Summary
| Measurement | Indian (Asian) Data | Married-couple Households Data |
| Minimum | 0.19% | 26.0% |
| Maximum | 58.7% | 81.5% |
| Range | 58.5% | 55.5% |
| Mean | 23.3% | 51.9% |
| Median | 21.9% | 51.0% |
| Interquartile 25% (IQ1) | 10.8% | 47.1% |
| Interquartile 75% (IQ3) | 34.9% | 57.6% |
| Interquartile Range (IQR) | 24.1% | 10.5% |
| Standard Deviation (Sample) | 14.7% | 9.1% |
| Standard Deviation (Population) | 14.7% | 9.0% |
Correlation Details
| Indian (Asian) Percentile | Sample Size | Married-couple Households |
[ 0.0% - 0.5% ] 0.19% | 140,481,361 | 45.0% |
[ 0.5% - 1.0% ] 0.57% | 108,180,173 | 45.5% |
[ 0.5% - 1.0% ] 0.95% | 62,708,324 | 46.9% |
[ 1.0% - 1.5% ] 1.34% | 36,225,591 | 47.0% |
[ 1.5% - 2.0% ] 1.72% | 25,886,234 | 49.5% |
[ 2.0% - 2.5% ] 2.11% | 17,521,836 | 49.2% |
[ 2.5% - 3.0% ] 2.51% | 18,093,511 | 44.9% |
[ 2.5% - 3.0% ] 2.91% | 11,435,823 | 46.3% |
[ 3.0% - 3.5% ] 3.29% | 6,934,662 | 51.2% |
[ 3.5% - 4.0% ] 3.67% | 5,982,567 | 52.2% |
[ 4.0% - 4.5% ] 4.08% | 5,824,332 | 48.6% |
[ 4.0% - 4.5% ] 4.48% | 3,411,363 | 52.4% |
[ 4.5% - 5.0% ] 4.83% | 3,302,349 | 49.9% |
[ 5.0% - 5.5% ] 5.22% | 4,106,200 | 46.4% |
[ 5.5% - 6.0% ] 5.64% | 2,344,869 | 52.3% |
[ 5.5% - 6.0% ] 6.00% | 2,219,929 | 50.8% |
[ 6.0% - 6.5% ] 6.42% | 1,648,324 | 52.1% |
[ 6.5% - 7.0% ] 6.77% | 1,855,857 | 48.9% |
[ 7.0% - 7.5% ] 7.25% | 10,877,088 | 38.1% |
[ 7.5% - 8.0% ] 7.61% | 1,073,076 | 49.1% |
[ 7.5% - 8.0% ] 7.95% | 1,294,937 | 49.5% |
[ 8.0% - 8.5% ] 8.35% | 1,285,701 | 46.7% |
[ 8.5% - 9.0% ] 8.71% | 1,900,713 | 47.3% |
[ 9.0% - 9.5% ] 9.15% | 717,546 | 55.6% |
[ 9.5% - 10.0% ] 9.51% | 770,148 | 50.0% |
[ 9.5% - 10.0% ] 9.99% | 1,473,847 | 54.3% |
[ 10.0% - 10.5% ] 10.30% | 419,381 | 61.7% |
[ 10.5% - 11.0% ] 10.62% | 417,648 | 45.0% |
[ 11.0% - 11.5% ] 11.04% | 689,816 | 50.0% |
[ 11.0% - 11.5% ] 11.44% | 566,419 | 54.7% |
[ 11.5% - 12.0% ] 11.84% | 714,372 | 51.8% |
[ 12.0% - 12.5% ] 12.19% | 770,160 | 53.6% |
[ 12.5% - 13.0% ] 12.63% | 681,596 | 57.3% |
[ 13.0% - 13.5% ] 13.00% | 445,057 | 62.6% |
[ 13.0% - 13.5% ] 13.42% | 232,183 | 49.2% |
[ 13.5% - 14.0% ] 13.81% | 337,572 | 47.8% |
[ 14.0% - 14.5% ] 14.09% | 552,650 | 47.1% |
[ 14.5% - 15.0% ] 14.59% | 202,223 | 61.7% |
[ 14.5% - 15.0% ] 14.93% | 469,153 | 57.6% |
[ 15.0% - 15.5% ] 15.27% | 749,333 | 58.7% |
[ 15.5% - 16.0% ] 15.71% | 460,901 | 50.0% |
[ 16.0% - 16.5% ] 16.08% | 276,336 | 51.0% |
[ 16.0% - 16.5% ] 16.40% | 515,007 | 49.0% |
[ 16.5% - 17.0% ] 16.89% | 420,482 | 59.2% |
[ 17.0% - 17.5% ] 17.21% | 102,809 | 49.1% |
[ 17.5% - 18.0% ] 17.63% | 332,971 | 51.2% |
[ 17.5% - 18.0% ] 17.97% | 641,695 | 48.3% |
[ 18.0% - 18.5% ] 18.43% | 527,450 | 56.8% |
[ 18.5% - 19.0% ] 18.87% | 338,253 | 47.6% |
[ 19.0% - 19.5% ] 19.11% | 110,633 | 54.7% |
[ 19.0% - 19.5% ] 19.48% | 319,065 | 60.9% |
[ 20.0% - 20.5% ] 20.02% | 795,534 | 47.4% |
[ 20.0% - 20.5% ] 20.43% | 107,024 | 48.1% |
[ 20.5% - 21.0% ] 20.74% | 236,857 | 45.5% |
[ 21.0% - 21.5% ] 21.21% | 66,476 | 59.2% |
[ 21.0% - 21.5% ] 21.41% | 203,886 | 59.1% |
[ 21.5% - 22.0% ] 21.85% | 64,946 | 48.8% |
[ 22.0% - 22.5% ] 22.30% | 76,137 | 68.4% |
[ 22.5% - 23.0% ] 22.71% | 133,398 | 58.7% |
[ 23.0% - 23.5% ] 23.09% | 144,601 | 51.6% |
[ 23.0% - 23.5% ] 23.36% | 862,624 | 36.1% |
[ 23.5% - 24.0% ] 23.95% | 60,815 | 45.5% |
[ 24.0% - 24.5% ] 24.23% | 181,482 | 60.4% |
[ 24.5% - 25.0% ] 24.58% | 45,466 | 61.6% |
[ 25.0% - 25.5% ] 25.46% | 58,529 | 55.8% |
[ 25.5% - 26.0% ] 25.62% | 91,833 | 61.0% |
[ 26.0% - 26.5% ] 26.11% | 23,343 | 26.0% |
[ 26.5% - 27.0% ] 26.69% | 50,734 | 60.8% |
[ 26.5% - 27.0% ] 26.85% | 88,531 | 47.1% |
[ 27.0% - 27.5% ] 27.32% | 29,394 | 39.7% |
[ 27.5% - 28.0% ] 27.87% | 125,567 | 58.5% |
[ 27.5% - 28.0% ] 27.93% | 52,707 | 32.0% |
[ 28.0% - 28.5% ] 28.48% | 108,626 | 57.6% |
[ 28.5% - 29.0% ] 28.77% | 46,424 | 54.1% |
[ 29.0% - 29.5% ] 29.13% | 128,689 | 67.9% |
[ 29.5% - 30.0% ] 29.57% | 90,121 | 66.4% |
[ 29.5% - 30.0% ] 29.99% | 90,534 | 71.0% |
[ 30.0% - 30.5% ] 30.34% | 118,437 | 46.3% |
[ 30.5% - 31.0% ] 30.73% | 192 | 40.7% |
[ 31.0% - 31.5% ] 31.18% | 19,928 | 40.9% |
[ 31.5% - 32.0% ] 31.53% | 48,930 | 60.7% |
[ 32.0% - 32.5% ] 32.10% | 38,554 | 55.7% |
[ 32.0% - 32.5% ] 32.32% | 98,730 | 59.4% |
[ 34.0% - 34.5% ] 34.02% | 135,971 | 34.5% |
[ 34.0% - 34.5% ] 34.14% | 43,304 | 45.0% |
[ 35.5% - 36.0% ] 35.63% | 80,880 | 51.0% |
[ 36.0% - 36.5% ] 36.18% | 65,922 | 53.8% |
[ 36.5% - 37.0% ] 36.54% | 31,986 | 59.9% |
[ 37.0% - 37.5% ] 37.05% | 62,692 | 48.9% |
[ 37.0% - 37.5% ] 37.29% | 141,083 | 50.4% |
[ 38.0% - 38.5% ] 38.11% | 129,504 | 51.2% |
[ 38.5% - 39.0% ] 38.57% | 115,076 | 50.4% |
[ 38.5% - 39.0% ] 38.86% | 85,525 | 64.0% |
[ 39.0% - 39.5% ] 39.20% | 7,786 | 60.1% |
[ 40.0% - 40.5% ] 40.23% | 23,014 | 52.0% |
[ 40.5% - 41.0% ] 40.62% | 28,212 | 70.0% |
[ 40.5% - 41.0% ] 40.74% | 2,852 | 81.5% |
[ 41.5% - 42.0% ] 41.51% | 33,937 | 46.8% |
[ 42.5% - 43.0% ] 42.62% | 60,364 | 55.7% |
[ 43.0% - 43.5% ] 43.21% | 83,114 | 53.3% |
[ 43.5% - 44.0% ] 43.76% | 91,781 | 52.3% |
[ 43.5% - 44.0% ] 43.92% | 25,460 | 31.6% |
[ 45.0% - 45.5% ] 45.16% | 37,340 | 48.4% |
[ 46.0% - 46.5% ] 46.03% | 63 | 75.0% |
[ 46.0% - 46.5% ] 46.32% | 557 | 35.5% |
[ 46.5% - 47.0% ] 46.81% | 329 | 45.1% |
[ 47.0% - 47.5% ] 47.13% | 89,536 | 50.8% |
[ 47.5% - 48.0% ] 47.81% | 96,393 | 52.7% |
[ 49.0% - 49.5% ] 49.15% | 12,070 | 26.3% |
[ 49.5% - 50.0% ] 49.57% | 117 | 42.6% |
[ 54.0% - 54.5% ] 54.04% | 25,001 | 68.6% |
[ 55.5% - 56.0% ] 55.81% | 26,418 | 56.6% |
[ 58.5% - 59.0% ] 58.72% | 79,495 | 49.4% |