Indian (Asian) Family Households with Children
COMPARE
Indian (Asian)
Select to Compare
Family Households with Children
Indian (Asian) Family Households with Children
27.6%
FAMILY HOUSEHOLDS WITH CHILDREN
71.6/ 100
METRIC RATING
157th/ 347
METRIC RANK
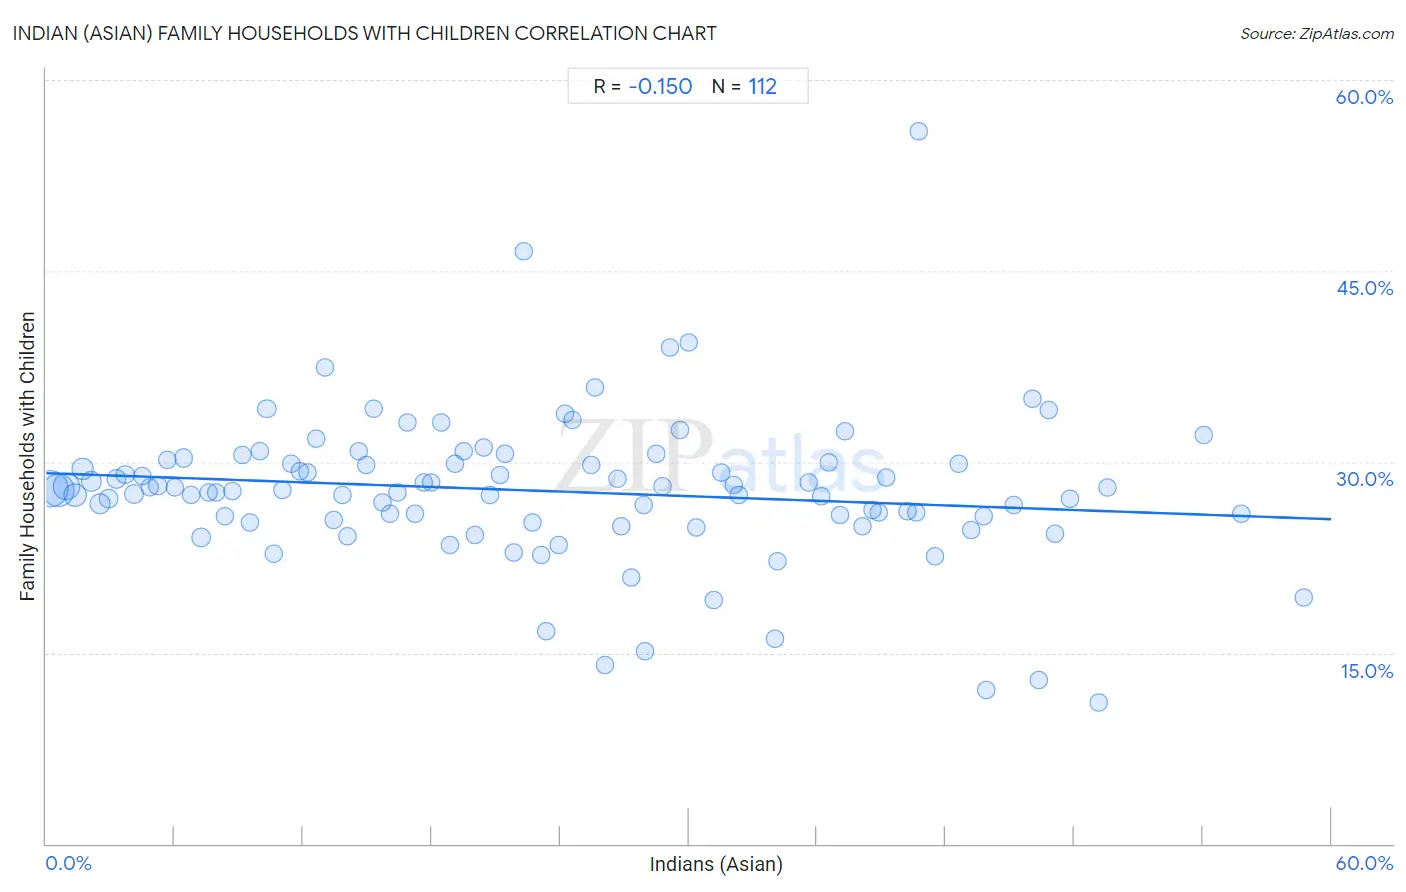
Indian (Asian) Family Households with Children Correlation Chart
The statistical analysis conducted on geographies consisting of 494,524,246 people shows a poor negative correlation between the proportion of Indians (Asian) and percentage of family households with children in the United States with a correlation coefficient (R) of -0.150 and weighted average of 27.6%. On average, for every 1% (one percent) increase in Indians (Asian) within a typical geography, there is a decrease of 0.060% in percentage of family households with children.
It is essential to understand that the correlation between the percentage of Indians (Asian) and percentage of family households with children does not imply a direct cause-and-effect relationship. It remains uncertain whether the presence of Indians (Asian) influences an upward or downward trend in the level of percentage of family households with children within an area, or if Indians (Asian) simply ended up residing in those areas with higher or lower levels of percentage of family households with children due to other factors.
Demographics Similar to Indians (Asian) by Family Households with Children
In terms of family households with children, the demographic groups most similar to Indians (Asian) are Romanian (27.6%, a difference of 0.020%), Mongolian (27.6%, a difference of 0.020%), Hungarian (27.6%, a difference of 0.080%), Comanche (27.6%, a difference of 0.090%), and Icelander (27.6%, a difference of 0.10%).
| Demographics | Rating | Rank | Family Households with Children |
| Argentineans | 78.5 /100 | #150 | Good 27.6% |
| Portuguese | 77.8 /100 | #151 | Good 27.6% |
| Ethiopians | 77.0 /100 | #152 | Good 27.6% |
| Immigrants from Cabo Verde | 75.6 /100 | #153 | Good 27.6% |
| Icelanders | 75.3 /100 | #154 | Good 27.6% |
| Comanche | 74.8 /100 | #155 | Good 27.6% |
| Hungarians | 74.6 /100 | #156 | Good 27.6% |
| Indians (Asian) | 71.6 /100 | #157 | Good 27.6% |
| Romanians | 70.8 /100 | #158 | Good 27.6% |
| Mongolians | 70.7 /100 | #159 | Good 27.6% |
| Sub-Saharan Africans | 67.5 /100 | #160 | Good 27.6% |
| Alaskan Athabascans | 67.1 /100 | #161 | Good 27.6% |
| Immigrants from Bangladesh | 67.0 /100 | #162 | Good 27.6% |
| Czechs | 65.3 /100 | #163 | Good 27.5% |
| Immigrants from Hong Kong | 64.9 /100 | #164 | Good 27.5% |
Indian (Asian) Family Households with Children Correlation Summary
| Measurement | Indian (Asian) Data | Family Households with Children Data |
| Minimum | 0.19% | 11.1% |
| Maximum | 58.7% | 55.9% |
| Range | 58.5% | 44.9% |
| Mean | 23.2% | 27.7% |
| Median | 21.6% | 27.8% |
| Interquartile 25% (IQ1) | 10.8% | 25.6% |
| Interquartile 75% (IQ3) | 34.9% | 29.9% |
| Interquartile Range (IQR) | 24.1% | 4.3% |
| Standard Deviation (Sample) | 14.8% | 5.9% |
| Standard Deviation (Population) | 14.7% | 5.9% |
Correlation Details
| Indian (Asian) Percentile | Sample Size | Family Households with Children |
[ 0.0% - 0.5% ] 0.19% | 140,434,144 | 27.8% |
[ 0.5% - 1.0% ] 0.57% | 108,161,274 | 27.8% |
[ 0.5% - 1.0% ] 0.95% | 62,689,304 | 28.1% |
[ 1.0% - 1.5% ] 1.34% | 36,201,684 | 27.4% |
[ 1.5% - 2.0% ] 1.72% | 25,882,476 | 29.5% |
[ 2.0% - 2.5% ] 2.11% | 17,512,040 | 28.5% |
[ 2.5% - 3.0% ] 2.51% | 18,092,341 | 26.7% |
[ 2.5% - 3.0% ] 2.91% | 11,434,023 | 27.1% |
[ 3.0% - 3.5% ] 3.29% | 6,927,564 | 28.6% |
[ 3.5% - 4.0% ] 3.67% | 5,973,016 | 29.0% |
[ 4.0% - 4.5% ] 4.08% | 5,824,332 | 27.5% |
[ 4.0% - 4.5% ] 4.48% | 3,400,588 | 28.9% |
[ 4.5% - 5.0% ] 4.83% | 3,299,842 | 28.0% |
[ 5.0% - 5.5% ] 5.22% | 4,106,045 | 28.1% |
[ 5.5% - 6.0% ] 5.64% | 2,344,869 | 30.2% |
[ 5.5% - 6.0% ] 6.00% | 2,217,561 | 28.0% |
[ 6.0% - 6.5% ] 6.42% | 1,648,324 | 30.3% |
[ 6.5% - 7.0% ] 6.77% | 1,855,650 | 27.4% |
[ 7.0% - 7.5% ] 7.25% | 10,876,832 | 24.0% |
[ 7.5% - 8.0% ] 7.61% | 1,066,887 | 27.6% |
[ 7.5% - 8.0% ] 7.94% | 1,248,044 | 27.6% |
[ 8.0% - 8.5% ] 8.35% | 1,285,701 | 25.7% |
[ 8.5% - 9.0% ] 8.71% | 1,900,713 | 27.7% |
[ 9.0% - 9.5% ] 9.15% | 717,546 | 30.6% |
[ 9.5% - 10.0% ] 9.51% | 769,969 | 25.2% |
[ 9.5% - 10.0% ] 9.99% | 1,473,559 | 30.9% |
[ 10.0% - 10.5% ] 10.30% | 419,381 | 34.2% |
[ 10.5% - 11.0% ] 10.62% | 417,376 | 22.8% |
[ 11.0% - 11.5% ] 11.04% | 680,393 | 27.8% |
[ 11.0% - 11.5% ] 11.44% | 566,419 | 29.8% |
[ 11.5% - 12.0% ] 11.84% | 714,322 | 29.3% |
[ 12.0% - 12.5% ] 12.19% | 770,160 | 29.2% |
[ 12.5% - 13.0% ] 12.63% | 681,128 | 31.8% |
[ 13.0% - 13.5% ] 13.00% | 442,968 | 37.4% |
[ 13.0% - 13.5% ] 13.42% | 232,183 | 25.5% |
[ 13.5% - 14.0% ] 13.81% | 337,572 | 27.4% |
[ 14.0% - 14.5% ] 14.09% | 552,650 | 24.2% |
[ 14.5% - 15.0% ] 14.59% | 202,223 | 30.9% |
[ 14.5% - 15.0% ] 14.93% | 469,153 | 29.7% |
[ 15.0% - 15.5% ] 15.27% | 749,333 | 34.2% |
[ 15.5% - 16.0% ] 15.71% | 460,901 | 26.8% |
[ 16.0% - 16.5% ] 16.08% | 276,336 | 25.9% |
[ 16.0% - 16.5% ] 16.40% | 515,007 | 27.6% |
[ 16.5% - 17.0% ] 16.89% | 420,482 | 33.1% |
[ 17.0% - 17.5% ] 17.21% | 102,809 | 25.9% |
[ 17.5% - 18.0% ] 17.63% | 332,971 | 28.4% |
[ 17.5% - 18.0% ] 17.97% | 641,507 | 28.4% |
[ 18.0% - 18.5% ] 18.43% | 527,450 | 33.1% |
[ 18.5% - 19.0% ] 18.87% | 338,253 | 23.5% |
[ 19.0% - 19.5% ] 19.11% | 110,633 | 29.9% |
[ 19.0% - 19.5% ] 19.48% | 319,065 | 30.8% |
[ 20.0% - 20.5% ] 20.02% | 795,534 | 24.2% |
[ 20.0% - 20.5% ] 20.43% | 107,024 | 31.1% |
[ 20.5% - 21.0% ] 20.74% | 236,857 | 27.4% |
[ 21.0% - 21.5% ] 21.21% | 66,476 | 29.0% |
[ 21.0% - 21.5% ] 21.41% | 203,886 | 30.7% |
[ 21.5% - 22.0% ] 21.85% | 64,946 | 22.9% |
[ 22.0% - 22.5% ] 22.29% | 70,768 | 46.6% |
[ 22.5% - 23.0% ] 22.71% | 133,398 | 25.2% |
[ 23.0% - 23.5% ] 23.09% | 144,601 | 22.7% |
[ 23.0% - 23.5% ] 23.36% | 862,624 | 16.7% |
[ 23.5% - 24.0% ] 23.95% | 60,815 | 23.4% |
[ 24.0% - 24.5% ] 24.23% | 181,482 | 33.8% |
[ 24.5% - 25.0% ] 24.58% | 45,466 | 33.3% |
[ 25.0% - 25.5% ] 25.46% | 58,529 | 29.8% |
[ 25.5% - 26.0% ] 25.62% | 91,833 | 35.8% |
[ 26.0% - 26.5% ] 26.11% | 23,343 | 14.1% |
[ 26.5% - 27.0% ] 26.69% | 50,734 | 28.7% |
[ 26.5% - 27.0% ] 26.85% | 88,531 | 24.9% |
[ 27.0% - 27.5% ] 27.32% | 29,394 | 20.9% |
[ 27.5% - 28.0% ] 27.87% | 125,567 | 26.7% |
[ 27.5% - 28.0% ] 27.93% | 52,707 | 15.1% |
[ 28.0% - 28.5% ] 28.48% | 108,626 | 30.7% |
[ 28.5% - 29.0% ] 28.77% | 46,424 | 28.1% |
[ 29.0% - 29.5% ] 29.13% | 128,689 | 39.0% |
[ 29.5% - 30.0% ] 29.57% | 90,121 | 32.5% |
[ 29.5% - 30.0% ] 29.99% | 90,534 | 39.4% |
[ 30.0% - 30.5% ] 30.34% | 118,437 | 24.8% |
[ 31.0% - 31.5% ] 31.18% | 19,928 | 19.1% |
[ 31.5% - 32.0% ] 31.53% | 48,930 | 29.1% |
[ 32.0% - 32.5% ] 32.10% | 38,554 | 28.1% |
[ 32.0% - 32.5% ] 32.32% | 98,730 | 27.4% |
[ 34.0% - 34.5% ] 34.02% | 135,971 | 16.1% |
[ 34.0% - 34.5% ] 34.14% | 43,304 | 22.2% |
[ 35.5% - 36.0% ] 35.63% | 80,880 | 28.3% |
[ 36.0% - 36.5% ] 36.18% | 65,922 | 27.3% |
[ 36.5% - 37.0% ] 36.54% | 31,986 | 29.9% |
[ 37.0% - 37.5% ] 37.05% | 62,692 | 25.8% |
[ 37.0% - 37.5% ] 37.29% | 141,083 | 32.4% |
[ 38.0% - 38.5% ] 38.11% | 129,504 | 24.9% |
[ 38.5% - 39.0% ] 38.57% | 115,076 | 26.2% |
[ 38.5% - 39.0% ] 38.86% | 85,525 | 26.0% |
[ 39.0% - 39.5% ] 39.20% | 7,786 | 28.8% |
[ 40.0% - 40.5% ] 40.23% | 23,014 | 26.1% |
[ 40.5% - 41.0% ] 40.62% | 28,212 | 26.0% |
[ 40.5% - 41.0% ] 40.74% | 2,825 | 55.9% |
[ 41.5% - 42.0% ] 41.51% | 33,937 | 22.6% |
[ 42.5% - 43.0% ] 42.62% | 60,364 | 29.9% |
[ 43.0% - 43.5% ] 43.21% | 83,114 | 24.7% |
[ 43.5% - 44.0% ] 43.76% | 91,781 | 25.8% |
[ 43.5% - 44.0% ] 43.92% | 25,460 | 12.1% |
[ 45.0% - 45.5% ] 45.16% | 37,340 | 26.6% |
[ 46.0% - 46.5% ] 46.03% | 63 | 35.0% |
[ 46.0% - 46.5% ] 46.32% | 557 | 12.9% |
[ 46.5% - 47.0% ] 46.81% | 329 | 34.0% |
[ 47.0% - 47.5% ] 47.13% | 89,536 | 24.3% |
[ 47.5% - 48.0% ] 47.81% | 96,393 | 27.2% |
[ 49.0% - 49.5% ] 49.15% | 12,070 | 11.1% |
[ 49.5% - 50.0% ] 49.57% | 117 | 27.9% |
[ 54.0% - 54.5% ] 54.04% | 25,001 | 32.1% |
[ 55.5% - 56.0% ] 55.81% | 26,418 | 25.9% |
[ 58.5% - 59.0% ] 58.72% | 79,495 | 19.4% |