Indian (Asian) Self-Care Disability
COMPARE
Indian (Asian)
Select to Compare
Self-Care Disability
Indian (Asian) Self-Care Disability
2.3%
SELF-CARE DISABILITY
98.7/ 100
METRIC RATING
83rd/ 347
METRIC RANK
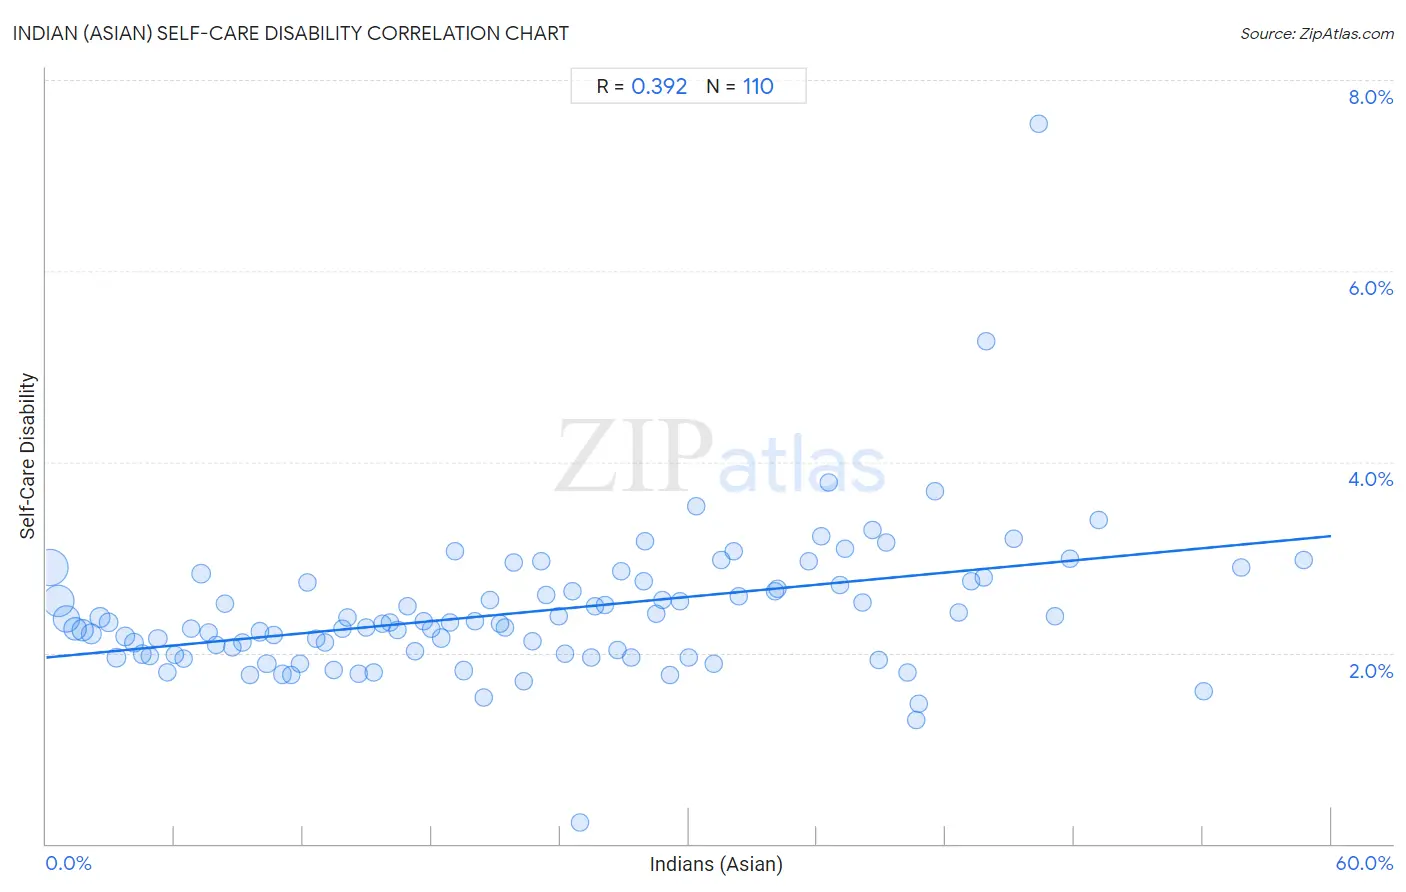
Indian (Asian) Self-Care Disability Correlation Chart
The statistical analysis conducted on geographies consisting of 494,223,906 people shows a mild positive correlation between the proportion of Indians (Asian) and percentage of population with self-care disability in the United States with a correlation coefficient (R) of 0.392 and weighted average of 2.3%. On average, for every 1% (one percent) increase in Indians (Asian) within a typical geography, there is an increase of 0.021% in percentage of population with self-care disability.
It is essential to understand that the correlation between the percentage of Indians (Asian) and percentage of population with self-care disability does not imply a direct cause-and-effect relationship. It remains uncertain whether the presence of Indians (Asian) influences an upward or downward trend in the level of percentage of population with self-care disability within an area, or if Indians (Asian) simply ended up residing in those areas with higher or lower levels of percentage of population with self-care disability due to other factors.
Demographics Similar to Indians (Asian) by Self-Care Disability
In terms of self-care disability, the demographic groups most similar to Indians (Asian) are Immigrants from Spain (2.3%, a difference of 0.040%), Ugandan (2.3%, a difference of 0.070%), Immigrants from Denmark (2.3%, a difference of 0.070%), Chilean (2.3%, a difference of 0.14%), and Immigrants from Middle Africa (2.3%, a difference of 0.33%).
| Demographics | Rating | Rank | Self-Care Disability |
| Immigrants from China | 99.1 /100 | #76 | Exceptional 2.3% |
| Immigrants from Middle Africa | 99.0 /100 | #77 | Exceptional 2.3% |
| Immigrants from Ireland | 99.0 /100 | #78 | Exceptional 2.3% |
| Immigrants from Kenya | 99.0 /100 | #79 | Exceptional 2.3% |
| Chileans | 98.8 /100 | #80 | Exceptional 2.3% |
| Ugandans | 98.8 /100 | #81 | Exceptional 2.3% |
| Immigrants from Denmark | 98.8 /100 | #82 | Exceptional 2.3% |
| Indians (Asian) | 98.7 /100 | #83 | Exceptional 2.3% |
| Immigrants from Spain | 98.7 /100 | #84 | Exceptional 2.3% |
| Estonians | 98.3 /100 | #85 | Exceptional 2.3% |
| Immigrants from Northern Africa | 98.2 /100 | #86 | Exceptional 2.3% |
| Sierra Leoneans | 98.0 /100 | #87 | Exceptional 2.4% |
| Lithuanians | 98.0 /100 | #88 | Exceptional 2.4% |
| Immigrants from Congo | 98.0 /100 | #89 | Exceptional 2.4% |
| Immigrants from Czechoslovakia | 97.7 /100 | #90 | Exceptional 2.4% |
Indian (Asian) Self-Care Disability Correlation Summary
| Measurement | Indian (Asian) Data | Self-Care Disability Data |
| Minimum | 0.19% | 0.22% |
| Maximum | 58.7% | 7.5% |
| Range | 58.5% | 7.3% |
| Mean | 22.6% | 2.4% |
| Median | 21.3% | 2.3% |
| Interquartile 25% (IQ1) | 10.6% | 2.0% |
| Interquartile 75% (IQ3) | 32.3% | 2.7% |
| Interquartile Range (IQR) | 21.7% | 0.76% |
| Standard Deviation (Sample) | 14.3% | 0.78% |
| Standard Deviation (Population) | 14.3% | 0.77% |
Correlation Details
| Indian (Asian) Percentile | Sample Size | Self-Care Disability |
[ 0.0% - 0.5% ] 0.19% | 140,382,819 | 2.9% |
[ 0.5% - 1.0% ] 0.57% | 108,054,504 | 2.5% |
[ 0.5% - 1.0% ] 0.95% | 62,629,287 | 2.4% |
[ 1.0% - 1.5% ] 1.34% | 36,218,348 | 2.3% |
[ 1.5% - 2.0% ] 1.72% | 25,864,190 | 2.2% |
[ 2.0% - 2.5% ] 2.11% | 17,489,638 | 2.2% |
[ 2.5% - 3.0% ] 2.51% | 18,086,785 | 2.4% |
[ 2.5% - 3.0% ] 2.91% | 11,427,914 | 2.3% |
[ 3.0% - 3.5% ] 3.29% | 6,918,421 | 2.0% |
[ 3.5% - 4.0% ] 3.67% | 5,977,365 | 2.2% |
[ 4.0% - 4.5% ] 4.08% | 5,819,580 | 2.1% |
[ 4.0% - 4.5% ] 4.48% | 3,397,031 | 2.0% |
[ 4.5% - 5.0% ] 4.83% | 3,293,058 | 2.0% |
[ 5.0% - 5.5% ] 5.22% | 4,109,011 | 2.1% |
[ 5.5% - 6.0% ] 5.64% | 2,338,615 | 1.8% |
[ 5.5% - 6.0% ] 6.00% | 2,214,625 | 2.0% |
[ 6.0% - 6.5% ] 6.42% | 1,646,103 | 1.9% |
[ 6.5% - 7.0% ] 6.77% | 1,854,034 | 2.3% |
[ 7.0% - 7.5% ] 7.25% | 10,869,982 | 2.8% |
[ 7.5% - 8.0% ] 7.61% | 1,064,515 | 2.2% |
[ 7.5% - 8.0% ] 7.95% | 1,283,805 | 2.1% |
[ 8.0% - 8.5% ] 8.35% | 1,283,651 | 2.5% |
[ 8.5% - 9.0% ] 8.71% | 1,907,872 | 2.1% |
[ 9.0% - 9.5% ] 9.15% | 713,199 | 2.1% |
[ 9.5% - 10.0% ] 9.51% | 770,710 | 1.8% |
[ 9.5% - 10.0% ] 9.99% | 1,463,023 | 2.2% |
[ 10.0% - 10.5% ] 10.30% | 416,541 | 1.9% |
[ 10.5% - 11.0% ] 10.62% | 414,435 | 2.2% |
[ 11.0% - 11.5% ] 11.04% | 690,332 | 1.8% |
[ 11.0% - 11.5% ] 11.44% | 562,738 | 1.8% |
[ 11.5% - 12.0% ] 11.84% | 714,372 | 1.9% |
[ 12.0% - 12.5% ] 12.19% | 768,434 | 2.7% |
[ 12.5% - 13.0% ] 12.63% | 680,812 | 2.1% |
[ 13.0% - 13.5% ] 13.00% | 442,105 | 2.1% |
[ 13.0% - 13.5% ] 13.42% | 230,271 | 1.8% |
[ 13.5% - 14.0% ] 13.81% | 337,572 | 2.3% |
[ 14.0% - 14.5% ] 14.09% | 551,399 | 2.4% |
[ 14.5% - 15.0% ] 14.60% | 194,225 | 1.8% |
[ 14.5% - 15.0% ] 14.93% | 462,899 | 2.3% |
[ 15.0% - 15.5% ] 15.27% | 744,662 | 1.8% |
[ 15.5% - 16.0% ] 15.71% | 460,901 | 2.3% |
[ 16.0% - 16.5% ] 16.08% | 274,809 | 2.3% |
[ 16.0% - 16.5% ] 16.41% | 506,164 | 2.2% |
[ 16.5% - 17.0% ] 16.89% | 419,029 | 2.5% |
[ 17.0% - 17.5% ] 17.21% | 102,809 | 2.0% |
[ 17.5% - 18.0% ] 17.63% | 332,971 | 2.3% |
[ 17.5% - 18.0% ] 17.97% | 640,456 | 2.2% |
[ 18.0% - 18.5% ] 18.43% | 527,126 | 2.2% |
[ 18.5% - 19.0% ] 18.87% | 338,253 | 2.3% |
[ 19.0% - 19.5% ] 19.11% | 110,633 | 3.1% |
[ 19.0% - 19.5% ] 19.48% | 319,065 | 1.8% |
[ 20.0% - 20.5% ] 20.02% | 795,534 | 2.3% |
[ 20.0% - 20.5% ] 20.43% | 106,130 | 1.5% |
[ 20.5% - 21.0% ] 20.74% | 236,857 | 2.6% |
[ 21.0% - 21.5% ] 21.22% | 65,994 | 2.3% |
[ 21.0% - 21.5% ] 21.41% | 203,886 | 2.3% |
[ 21.5% - 22.0% ] 21.85% | 64,946 | 2.9% |
[ 22.0% - 22.5% ] 22.29% | 70,768 | 1.7% |
[ 22.5% - 23.0% ] 22.71% | 133,398 | 2.1% |
[ 23.0% - 23.5% ] 23.09% | 144,601 | 3.0% |
[ 23.0% - 23.5% ] 23.36% | 862,624 | 2.6% |
[ 23.5% - 24.0% ] 23.95% | 60,815 | 2.4% |
[ 24.0% - 24.5% ] 24.23% | 181,482 | 2.0% |
[ 24.5% - 25.0% ] 24.58% | 45,466 | 2.6% |
[ 24.5% - 25.0% ] 24.93% | 8,755 | 0.22% |
[ 25.0% - 25.5% ] 25.46% | 58,529 | 1.9% |
[ 25.5% - 26.0% ] 25.62% | 91,833 | 2.5% |
[ 26.0% - 26.5% ] 26.11% | 23,343 | 2.5% |
[ 26.5% - 27.0% ] 26.69% | 50,734 | 2.0% |
[ 26.5% - 27.0% ] 26.85% | 88,531 | 2.9% |
[ 27.0% - 27.5% ] 27.32% | 29,394 | 2.0% |
[ 27.5% - 28.0% ] 27.87% | 125,567 | 2.8% |
[ 27.5% - 28.0% ] 27.93% | 52,707 | 3.2% |
[ 28.0% - 28.5% ] 28.48% | 108,577 | 2.4% |
[ 28.5% - 29.0% ] 28.77% | 46,424 | 2.5% |
[ 29.0% - 29.5% ] 29.13% | 128,689 | 1.8% |
[ 29.5% - 30.0% ] 29.57% | 90,121 | 2.5% |
[ 29.5% - 30.0% ] 29.99% | 90,534 | 2.0% |
[ 30.0% - 30.5% ] 30.34% | 118,437 | 3.5% |
[ 31.0% - 31.5% ] 31.18% | 19,928 | 1.9% |
[ 31.5% - 32.0% ] 31.53% | 48,930 | 3.0% |
[ 32.0% - 32.5% ] 32.10% | 38,554 | 3.1% |
[ 32.0% - 32.5% ] 32.32% | 98,730 | 2.6% |
[ 34.0% - 34.5% ] 34.02% | 135,971 | 2.6% |
[ 34.0% - 34.5% ] 34.14% | 43,304 | 2.7% |
[ 35.5% - 36.0% ] 35.63% | 80,880 | 3.0% |
[ 36.0% - 36.5% ] 36.18% | 65,922 | 3.2% |
[ 36.5% - 37.0% ] 36.54% | 31,986 | 3.8% |
[ 37.0% - 37.5% ] 37.05% | 62,692 | 2.7% |
[ 37.0% - 37.5% ] 37.29% | 140,699 | 3.1% |
[ 38.0% - 38.5% ] 38.11% | 129,504 | 2.5% |
[ 38.5% - 39.0% ] 38.57% | 113,969 | 3.3% |
[ 38.5% - 39.0% ] 38.86% | 85,525 | 1.9% |
[ 39.0% - 39.5% ] 39.20% | 7,786 | 3.2% |
[ 40.0% - 40.5% ] 40.24% | 22,654 | 1.8% |
[ 40.5% - 41.0% ] 40.62% | 28,212 | 1.3% |
[ 40.5% - 41.0% ] 40.74% | 2,825 | 1.5% |
[ 41.5% - 42.0% ] 41.51% | 33,937 | 3.7% |
[ 42.5% - 43.0% ] 42.62% | 59,410 | 2.4% |
[ 43.0% - 43.5% ] 43.21% | 83,114 | 2.7% |
[ 43.5% - 44.0% ] 43.76% | 91,781 | 2.8% |
[ 43.5% - 44.0% ] 43.92% | 25,460 | 5.3% |
[ 45.0% - 45.5% ] 45.16% | 37,340 | 3.2% |
[ 46.0% - 46.5% ] 46.32% | 557 | 7.5% |
[ 47.0% - 47.5% ] 47.13% | 89,536 | 2.4% |
[ 47.5% - 48.0% ] 47.80% | 95,942 | 3.0% |
[ 49.0% - 49.5% ] 49.15% | 12,070 | 3.4% |
[ 54.0% - 54.5% ] 54.04% | 25,001 | 1.6% |
[ 55.5% - 56.0% ] 55.81% | 26,418 | 2.9% |
[ 58.5% - 59.0% ] 58.72% | 79,495 | 3.0% |