Indian (Asian) 4 or more Vehicles in Household
COMPARE
Indian (Asian)
Select to Compare
4 or more Vehicles in Household
Indian (Asian) 4 or more Vehicles in Household
6.4%
4+ VEHICLES AVAILABLE
66.3/ 100
METRIC RATING
159th/ 347
METRIC RANK
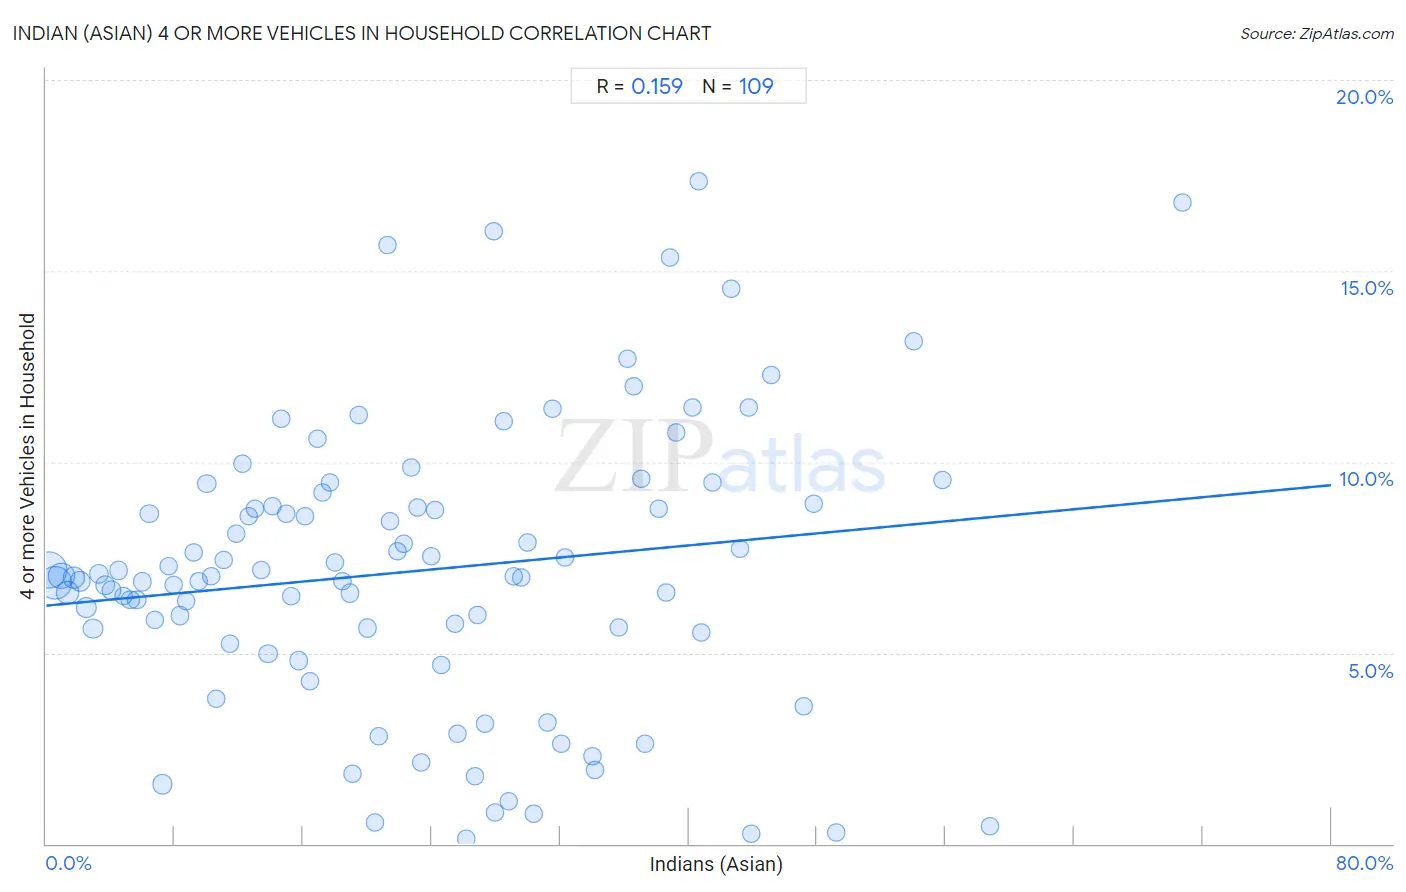
Indian (Asian) 4 or more Vehicles in Household Correlation Chart
The statistical analysis conducted on geographies consisting of 492,569,757 people shows a poor positive correlation between the proportion of Indians (Asian) and percentage of households with 4 or more vehicles available in the United States with a correlation coefficient (R) of 0.159 and weighted average of 6.4%. On average, for every 1% (one percent) increase in Indians (Asian) within a typical geography, there is an increase of 0.039% in percentage of households with 4 or more vehicles available.
It is essential to understand that the correlation between the percentage of Indians (Asian) and percentage of households with 4 or more vehicles available does not imply a direct cause-and-effect relationship. It remains uncertain whether the presence of Indians (Asian) influences an upward or downward trend in the level of percentage of households with 4 or more vehicles available within an area, or if Indians (Asian) simply ended up residing in those areas with higher or lower levels of percentage of households with 4 or more vehicles available due to other factors.
Demographics Similar to Indians (Asian) by 4 or more Vehicles in Household
In terms of 4 or more vehicles in household, the demographic groups most similar to Indians (Asian) are Palestinian (6.4%, a difference of 0.050%), Zimbabwean (6.4%, a difference of 0.090%), Immigrants from Cameroon (6.4%, a difference of 0.21%), Immigrants from Pakistan (6.4%, a difference of 0.33%), and Peruvian (6.5%, a difference of 0.36%).
| Demographics | Rating | Rank | 4 or more Vehicles in Household |
| Yuman | 72.1 /100 | #152 | Good 6.5% |
| Immigrants from Armenia | 71.2 /100 | #153 | Good 6.5% |
| Central American Indians | 71.1 /100 | #154 | Good 6.5% |
| Iroquois | 70.4 /100 | #155 | Good 6.5% |
| Iranians | 69.9 /100 | #156 | Good 6.5% |
| Peruvians | 69.4 /100 | #157 | Good 6.5% |
| Zimbabweans | 67.1 /100 | #158 | Good 6.4% |
| Indians (Asian) | 66.3 /100 | #159 | Good 6.4% |
| Palestinians | 65.8 /100 | #160 | Good 6.4% |
| Immigrants from Cameroon | 64.4 /100 | #161 | Good 6.4% |
| Immigrants from Pakistan | 63.2 /100 | #162 | Good 6.4% |
| Chileans | 61.2 /100 | #163 | Good 6.4% |
| Hungarians | 61.1 /100 | #164 | Good 6.4% |
| Immigrants from Peru | 59.8 /100 | #165 | Average 6.4% |
| Immigrants from Denmark | 57.8 /100 | #166 | Average 6.4% |
Indian (Asian) 4 or more Vehicles in Household Correlation Summary
| Measurement | Indian (Asian) Data | 4 or more Vehicles in Household Data |
| Minimum | 0.19% | 0.12% |
| Maximum | 70.7% | 17.4% |
| Range | 70.6% | 17.2% |
| Mean | 22.8% | 7.1% |
| Median | 21.2% | 7.0% |
| Interquartile 25% (IQ1) | 10.5% | 5.4% |
| Interquartile 75% (IQ3) | 33.2% | 8.9% |
| Interquartile Range (IQR) | 22.7% | 3.5% |
| Standard Deviation (Sample) | 15.0% | 3.7% |
| Standard Deviation (Population) | 14.9% | 3.7% |
Correlation Details
| Indian (Asian) Percentile | Sample Size | 4 or more Vehicles in Household |
[ 0.0% - 0.5% ] 0.19% | 140,253,146 | 7.2% |
[ 0.5% - 1.0% ] 0.57% | 107,942,997 | 6.8% |
[ 0.5% - 1.0% ] 0.95% | 62,541,410 | 7.0% |
[ 1.0% - 1.5% ] 1.34% | 36,055,947 | 6.6% |
[ 1.5% - 2.0% ] 1.72% | 25,624,521 | 7.0% |
[ 2.0% - 2.5% ] 2.11% | 17,460,317 | 6.9% |
[ 2.5% - 3.0% ] 2.51% | 18,053,539 | 6.2% |
[ 2.5% - 3.0% ] 2.91% | 11,376,249 | 5.6% |
[ 3.0% - 3.5% ] 3.29% | 6,918,370 | 7.1% |
[ 3.5% - 4.0% ] 3.67% | 5,969,528 | 6.8% |
[ 4.0% - 4.5% ] 4.08% | 5,650,396 | 6.6% |
[ 4.0% - 4.5% ] 4.48% | 3,355,637 | 7.2% |
[ 4.5% - 5.0% ] 4.83% | 3,285,279 | 6.5% |
[ 5.0% - 5.5% ] 5.22% | 4,050,311 | 6.4% |
[ 5.5% - 6.0% ] 5.64% | 2,304,783 | 6.4% |
[ 5.5% - 6.0% ] 6.00% | 2,196,240 | 6.9% |
[ 6.0% - 6.5% ] 6.42% | 1,635,053 | 8.6% |
[ 6.5% - 7.0% ] 6.77% | 1,851,491 | 5.9% |
[ 7.0% - 7.5% ] 7.25% | 10,857,128 | 1.6% |
[ 7.5% - 8.0% ] 7.61% | 1,036,880 | 7.3% |
[ 7.5% - 8.0% ] 7.94% | 1,244,940 | 6.8% |
[ 8.0% - 8.5% ] 8.35% | 1,188,315 | 6.0% |
[ 8.5% - 9.0% ] 8.71% | 1,883,719 | 6.3% |
[ 9.0% - 9.5% ] 9.15% | 707,808 | 7.6% |
[ 9.5% - 10.0% ] 9.51% | 751,586 | 6.9% |
[ 9.5% - 10.0% ] 9.99% | 1,428,144 | 9.4% |
[ 10.0% - 10.5% ] 10.30% | 417,907 | 7.0% |
[ 10.5% - 11.0% ] 10.62% | 417,161 | 3.8% |
[ 11.0% - 11.5% ] 11.05% | 631,249 | 7.4% |
[ 11.0% - 11.5% ] 11.44% | 528,407 | 5.2% |
[ 11.5% - 12.0% ] 11.84% | 693,760 | 8.1% |
[ 12.0% - 12.5% ] 12.19% | 765,736 | 9.9% |
[ 12.5% - 13.0% ] 12.63% | 666,293 | 8.6% |
[ 13.0% - 13.5% ] 13.00% | 441,829 | 8.8% |
[ 13.0% - 13.5% ] 13.42% | 226,068 | 7.2% |
[ 13.5% - 14.0% ] 13.81% | 336,669 | 5.0% |
[ 14.0% - 14.5% ] 14.08% | 531,630 | 8.8% |
[ 14.5% - 15.0% ] 14.60% | 194,676 | 11.1% |
[ 14.5% - 15.0% ] 14.93% | 462,899 | 8.6% |
[ 15.0% - 15.5% ] 15.27% | 744,662 | 6.5% |
[ 15.5% - 16.0% ] 15.71% | 460,901 | 4.8% |
[ 16.0% - 16.5% ] 16.08% | 276,336 | 8.6% |
[ 16.0% - 16.5% ] 16.41% | 506,164 | 4.3% |
[ 16.5% - 17.0% ] 16.89% | 419,225 | 10.6% |
[ 17.0% - 17.5% ] 17.21% | 102,809 | 9.2% |
[ 17.5% - 18.0% ] 17.63% | 332,971 | 9.4% |
[ 17.5% - 18.0% ] 17.97% | 636,185 | 7.4% |
[ 18.0% - 18.5% ] 18.43% | 527,126 | 6.9% |
[ 18.5% - 19.0% ] 18.87% | 338,253 | 6.6% |
[ 19.0% - 19.5% ] 19.10% | 99,192 | 1.8% |
[ 19.0% - 19.5% ] 19.48% | 318,655 | 11.2% |
[ 20.0% - 20.5% ] 20.02% | 795,534 | 5.6% |
[ 20.0% - 20.5% ] 20.43% | 107,024 | 0.55% |
[ 20.5% - 21.0% ] 20.74% | 228,628 | 2.8% |
[ 21.0% - 21.5% ] 21.21% | 66,476 | 15.7% |
[ 21.0% - 21.5% ] 21.41% | 203,886 | 8.5% |
[ 21.5% - 22.0% ] 21.85% | 64,946 | 7.6% |
[ 22.0% - 22.5% ] 22.29% | 70,768 | 7.8% |
[ 22.5% - 23.0% ] 22.71% | 133,398 | 9.9% |
[ 23.0% - 23.5% ] 23.09% | 144,601 | 8.8% |
[ 23.0% - 23.5% ] 23.36% | 862,624 | 2.1% |
[ 23.5% - 24.0% ] 23.95% | 60,815 | 7.5% |
[ 24.0% - 24.5% ] 24.23% | 181,482 | 8.8% |
[ 24.5% - 25.0% ] 24.58% | 45,466 | 4.7% |
[ 25.0% - 25.5% ] 25.46% | 48,324 | 5.8% |
[ 25.5% - 26.0% ] 25.62% | 91,833 | 2.9% |
[ 26.0% - 26.5% ] 26.11% | 23,343 | 0.12% |
[ 26.5% - 27.0% ] 26.69% | 50,734 | 1.8% |
[ 26.5% - 27.0% ] 26.85% | 88,531 | 6.0% |
[ 27.0% - 27.5% ] 27.32% | 29,394 | 3.1% |
[ 27.5% - 28.0% ] 27.87% | 124,609 | 16.1% |
[ 27.5% - 28.0% ] 27.93% | 52,707 | 0.83% |
[ 28.0% - 28.5% ] 28.48% | 108,577 | 11.1% |
[ 28.5% - 29.0% ] 28.77% | 46,424 | 1.1% |
[ 29.0% - 29.5% ] 29.13% | 128,689 | 7.0% |
[ 29.5% - 30.0% ] 29.57% | 90,121 | 7.0% |
[ 29.5% - 30.0% ] 29.99% | 90,534 | 7.9% |
[ 30.0% - 30.5% ] 30.34% | 118,437 | 0.79% |
[ 31.0% - 31.5% ] 31.18% | 19,928 | 3.2% |
[ 31.5% - 32.0% ] 31.53% | 48,930 | 11.4% |
[ 32.0% - 32.5% ] 32.10% | 38,554 | 2.6% |
[ 32.0% - 32.5% ] 32.32% | 98,730 | 7.5% |
[ 34.0% - 34.5% ] 34.02% | 135,971 | 2.3% |
[ 34.0% - 34.5% ] 34.14% | 43,304 | 1.9% |
[ 35.5% - 36.0% ] 35.63% | 80,880 | 5.6% |
[ 36.0% - 36.5% ] 36.18% | 65,922 | 12.7% |
[ 36.5% - 37.0% ] 36.54% | 31,986 | 12.0% |
[ 37.0% - 37.5% ] 37.06% | 54,275 | 9.6% |
[ 37.0% - 37.5% ] 37.29% | 140,984 | 2.6% |
[ 38.0% - 38.5% ] 38.11% | 129,504 | 8.8% |
[ 38.5% - 39.0% ] 38.57% | 113,969 | 6.6% |
[ 38.5% - 39.0% ] 38.86% | 85,525 | 15.4% |
[ 39.0% - 39.5% ] 39.20% | 7,786 | 10.8% |
[ 40.0% - 40.5% ] 40.23% | 23,014 | 11.4% |
[ 40.5% - 41.0% ] 40.62% | 28,212 | 17.4% |
[ 40.5% - 41.0% ] 40.74% | 2,825 | 5.5% |
[ 41.5% - 42.0% ] 41.51% | 33,937 | 9.5% |
[ 42.5% - 43.0% ] 42.62% | 60,364 | 14.5% |
[ 43.0% - 43.5% ] 43.21% | 83,114 | 7.7% |
[ 43.5% - 44.0% ] 43.76% | 91,781 | 11.4% |
[ 43.5% - 44.0% ] 43.92% | 25,460 | 0.27% |
[ 45.0% - 45.5% ] 45.16% | 37,340 | 12.3% |
[ 47.0% - 47.5% ] 47.13% | 89,536 | 3.6% |
[ 47.5% - 48.0% ] 47.81% | 96,393 | 8.9% |
[ 49.0% - 49.5% ] 49.15% | 12,070 | 0.29% |
[ 54.0% - 54.5% ] 54.04% | 25,001 | 13.2% |
[ 55.5% - 56.0% ] 55.81% | 26,418 | 9.5% |
[ 58.5% - 59.0% ] 58.72% | 79,495 | 0.45% |
[ 70.5% - 71.0% ] 70.75% | 147 | 16.8% |