Immigrants from South Eastern Asia Married-couple Households
COMPARE
Immigrants from South Eastern Asia
Select to Compare
Married-couple Households
Immigrants from South Eastern Asia Married-couple Households
48.4%
MARRIED-COUPLE HOUSEHOLDS
98.9/ 100
METRIC RATING
68th/ 347
METRIC RANK
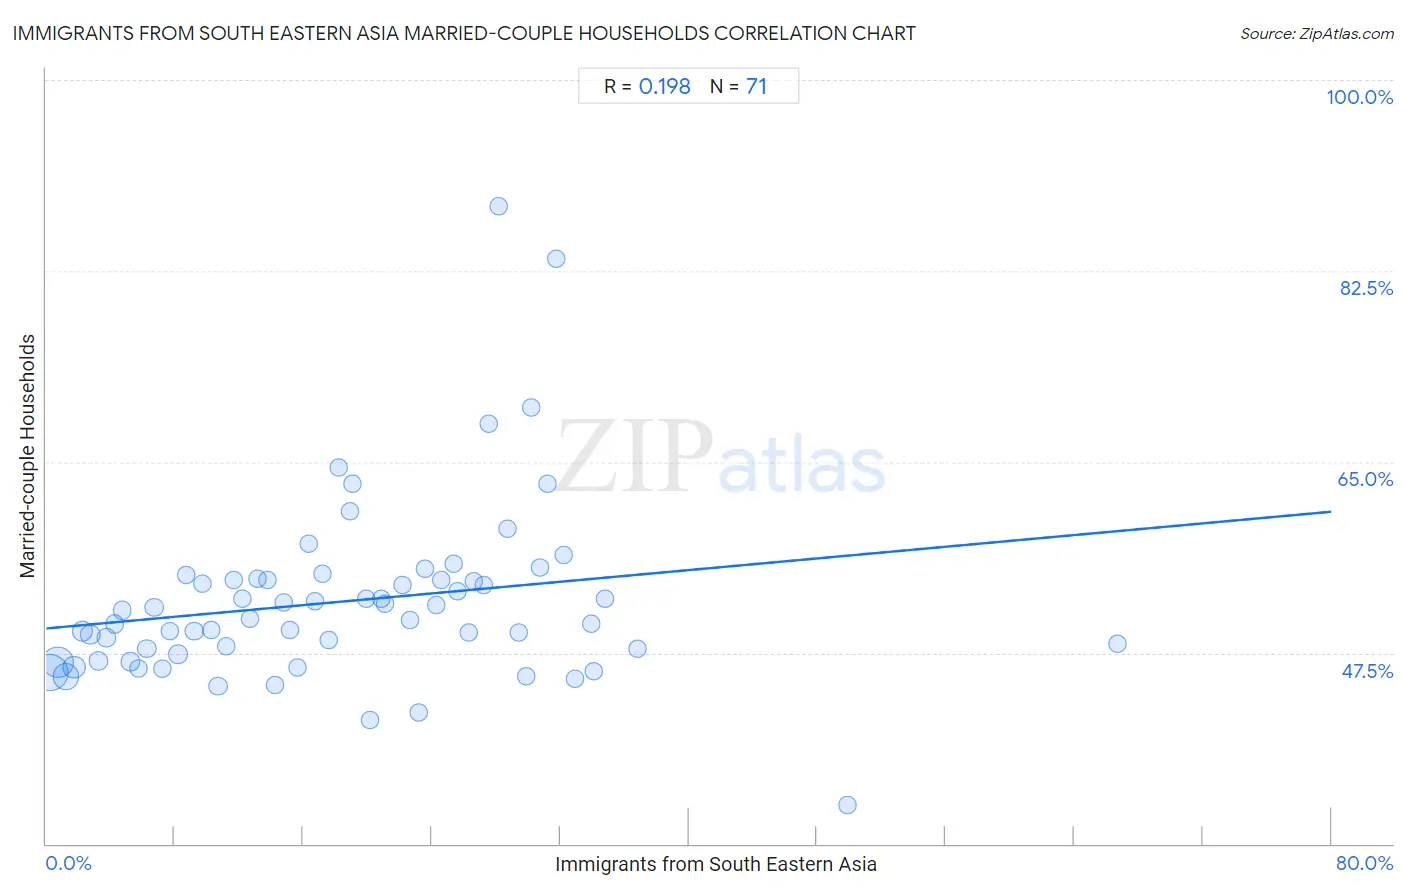
Immigrants from South Eastern Asia Married-couple Households Correlation Chart
The statistical analysis conducted on geographies consisting of 512,211,574 people shows a poor positive correlation between the proportion of Immigrants from South Eastern Asia and percentage of married-couple family households in the United States with a correlation coefficient (R) of 0.198 and weighted average of 48.4%. On average, for every 1% (one percent) increase in Immigrants from South Eastern Asia within a typical geography, there is an increase of 0.13% in percentage of married-couple family households.
It is essential to understand that the correlation between the percentage of Immigrants from South Eastern Asia and percentage of married-couple family households does not imply a direct cause-and-effect relationship. It remains uncertain whether the presence of Immigrants from South Eastern Asia influences an upward or downward trend in the level of percentage of married-couple family households within an area, or if Immigrants from South Eastern Asia simply ended up residing in those areas with higher or lower levels of percentage of married-couple family households due to other factors.
Demographics Similar to Immigrants from South Eastern Asia by Married-couple Households
In terms of married-couple households, the demographic groups most similar to Immigrants from South Eastern Asia are Immigrants from China (48.4%, a difference of 0.0%), Romanian (48.4%, a difference of 0.010%), Jordanian (48.4%, a difference of 0.020%), Immigrants from Canada (48.4%, a difference of 0.040%), and Immigrants from North America (48.4%, a difference of 0.040%).
| Demographics | Rating | Rank | Married-couple Households |
| Bulgarians | 99.1 /100 | #61 | Exceptional 48.5% |
| Luxembourgers | 99.1 /100 | #62 | Exceptional 48.5% |
| Basques | 99.0 /100 | #63 | Exceptional 48.4% |
| Northern Europeans | 99.0 /100 | #64 | Exceptional 48.4% |
| Immigrants from Canada | 99.0 /100 | #65 | Exceptional 48.4% |
| Jordanians | 98.9 /100 | #66 | Exceptional 48.4% |
| Romanians | 98.9 /100 | #67 | Exceptional 48.4% |
| Immigrants from South Eastern Asia | 98.9 /100 | #68 | Exceptional 48.4% |
| Immigrants from China | 98.9 /100 | #69 | Exceptional 48.4% |
| Immigrants from North America | 98.9 /100 | #70 | Exceptional 48.4% |
| Laotians | 98.8 /100 | #71 | Exceptional 48.4% |
| Scotch-Irish | 98.6 /100 | #72 | Exceptional 48.3% |
| Immigrants from Singapore | 98.6 /100 | #73 | Exceptional 48.3% |
| Immigrants from Romania | 98.6 /100 | #74 | Exceptional 48.3% |
| Immigrants from England | 98.4 /100 | #75 | Exceptional 48.2% |
Immigrants from South Eastern Asia Married-couple Households Correlation Summary
| Measurement | Immigrants from South Eastern Asia Data | Married-couple Households Data |
| Minimum | 0.25% | 33.6% |
| Maximum | 66.7% | 88.5% |
| Range | 66.4% | 54.9% |
| Mean | 18.6% | 52.2% |
| Median | 17.6% | 50.6% |
| Interquartile 25% (IQ1) | 8.7% | 47.4% |
| Interquartile 75% (IQ3) | 27.2% | 54.2% |
| Interquartile Range (IQR) | 18.5% | 6.9% |
| Standard Deviation (Sample) | 12.3% | 8.3% |
| Standard Deviation (Population) | 12.2% | 8.3% |
Correlation Details
| Immigrants from South Eastern Asia Percentile | Sample Size | Married-couple Households |
[ 0.0% - 0.5% ] 0.25% | 171,218,166 | 45.7% |
[ 0.5% - 1.0% ] 0.73% | 118,658,103 | 46.7% |
[ 1.0% - 1.5% ] 1.23% | 74,056,007 | 45.3% |
[ 1.5% - 2.0% ] 1.73% | 39,078,702 | 46.2% |
[ 2.0% - 2.5% ] 2.22% | 23,543,345 | 49.4% |
[ 2.5% - 3.0% ] 2.75% | 17,149,585 | 49.2% |
[ 3.0% - 3.5% ] 3.24% | 17,013,676 | 46.7% |
[ 3.5% - 4.0% ] 3.74% | 8,421,911 | 48.9% |
[ 4.0% - 4.5% ] 4.25% | 6,841,043 | 50.1% |
[ 4.5% - 5.0% ] 4.73% | 5,116,829 | 51.4% |
[ 5.0% - 5.5% ] 5.23% | 4,133,244 | 46.7% |
[ 5.5% - 6.0% ] 5.75% | 4,629,365 | 46.0% |
[ 6.0% - 6.5% ] 6.26% | 1,948,706 | 47.9% |
[ 6.5% - 7.0% ] 6.72% | 3,118,475 | 51.6% |
[ 7.0% - 7.5% ] 7.25% | 1,597,197 | 46.1% |
[ 7.5% - 8.0% ] 7.70% | 2,460,723 | 49.4% |
[ 8.0% - 8.5% ] 8.20% | 1,548,352 | 47.4% |
[ 8.5% - 9.0% ] 8.75% | 734,319 | 54.6% |
[ 9.0% - 9.5% ] 9.22% | 1,073,752 | 49.5% |
[ 9.5% - 10.0% ] 9.72% | 1,331,437 | 53.8% |
[ 10.0% - 10.5% ] 10.30% | 483,883 | 49.6% |
[ 10.5% - 11.0% ] 10.70% | 1,129,216 | 44.5% |
[ 11.0% - 11.5% ] 11.19% | 682,714 | 48.1% |
[ 11.5% - 12.0% ] 11.68% | 466,497 | 54.2% |
[ 12.0% - 12.5% ] 12.21% | 1,339,327 | 52.5% |
[ 12.5% - 13.0% ] 12.71% | 391,337 | 50.6% |
[ 13.0% - 13.5% ] 13.14% | 170,053 | 54.3% |
[ 13.5% - 14.0% ] 13.74% | 419,626 | 54.1% |
[ 14.0% - 14.5% ] 14.24% | 54,501 | 44.5% |
[ 14.5% - 15.0% ] 14.82% | 368,379 | 52.1% |
[ 15.0% - 15.5% ] 15.19% | 296,699 | 49.6% |
[ 15.5% - 16.0% ] 15.67% | 69,146 | 46.2% |
[ 16.0% - 16.5% ] 16.36% | 380,860 | 57.5% |
[ 16.5% - 17.0% ] 16.75% | 343,907 | 52.3% |
[ 17.0% - 17.5% ] 17.20% | 73,046 | 54.7% |
[ 17.5% - 18.0% ] 17.57% | 40,056 | 48.7% |
[ 18.0% - 18.5% ] 18.19% | 1,127 | 64.5% |
[ 18.5% - 19.0% ] 18.92% | 101,089 | 60.4% |
[ 19.0% - 19.5% ] 19.06% | 81,330 | 63.0% |
[ 19.5% - 20.0% ] 19.90% | 14,597 | 52.5% |
[ 20.0% - 20.5% ] 20.18% | 3,003 | 41.3% |
[ 20.5% - 21.0% ] 20.83% | 115,224 | 52.4% |
[ 21.0% - 21.5% ] 21.10% | 84,817 | 52.0% |
[ 22.0% - 22.5% ] 22.20% | 140,816 | 53.7% |
[ 22.5% - 23.0% ] 22.65% | 106,065 | 50.5% |
[ 23.0% - 23.5% ] 23.16% | 3,800 | 42.1% |
[ 23.5% - 24.0% ] 23.62% | 110,453 | 55.2% |
[ 24.0% - 24.5% ] 24.26% | 164,096 | 51.8% |
[ 24.5% - 25.0% ] 24.61% | 65,345 | 54.2% |
[ 25.0% - 25.5% ] 25.36% | 213,963 | 55.7% |
[ 25.5% - 26.0% ] 25.62% | 25,902 | 53.2% |
[ 26.0% - 26.5% ] 26.34% | 52,974 | 49.4% |
[ 26.5% - 27.0% ] 26.65% | 72,605 | 54.0% |
[ 27.0% - 27.5% ] 27.24% | 16,457 | 53.7% |
[ 27.5% - 28.0% ] 27.55% | 49,074 | 68.6% |
[ 28.0% - 28.5% ] 28.18% | 401 | 88.5% |
[ 28.5% - 29.0% ] 28.71% | 996 | 58.9% |
[ 29.0% - 29.5% ] 29.40% | 40,993 | 49.3% |
[ 29.5% - 30.0% ] 29.88% | 17,533 | 45.4% |
[ 30.0% - 30.5% ] 30.16% | 63 | 70.0% |
[ 30.5% - 31.0% ] 30.72% | 47,549 | 55.3% |
[ 31.0% - 31.5% ] 31.24% | 36,657 | 63.0% |
[ 31.5% - 32.0% ] 31.77% | 513 | 83.6% |
[ 32.0% - 32.5% ] 32.23% | 181,268 | 56.5% |
[ 32.5% - 33.0% ] 32.90% | 921 | 45.1% |
[ 33.5% - 34.0% ] 33.96% | 9,160 | 50.1% |
[ 34.0% - 34.5% ] 34.06% | 22,622 | 45.8% |
[ 34.5% - 35.0% ] 34.76% | 39,873 | 52.4% |
[ 36.5% - 37.0% ] 36.78% | 4,342 | 47.9% |
[ 49.5% - 50.0% ] 49.87% | 766 | 33.6% |
[ 66.5% - 67.0% ] 66.69% | 2,996 | 48.3% |