Immigrants from South Eastern Asia Self-Care Disability
COMPARE
Immigrants from South Eastern Asia
Select to Compare
Self-Care Disability
Immigrants from South Eastern Asia Self-Care Disability
2.5%
SELF-CARE DISABILITY
12.9/ 100
METRIC RATING
201st/ 347
METRIC RANK
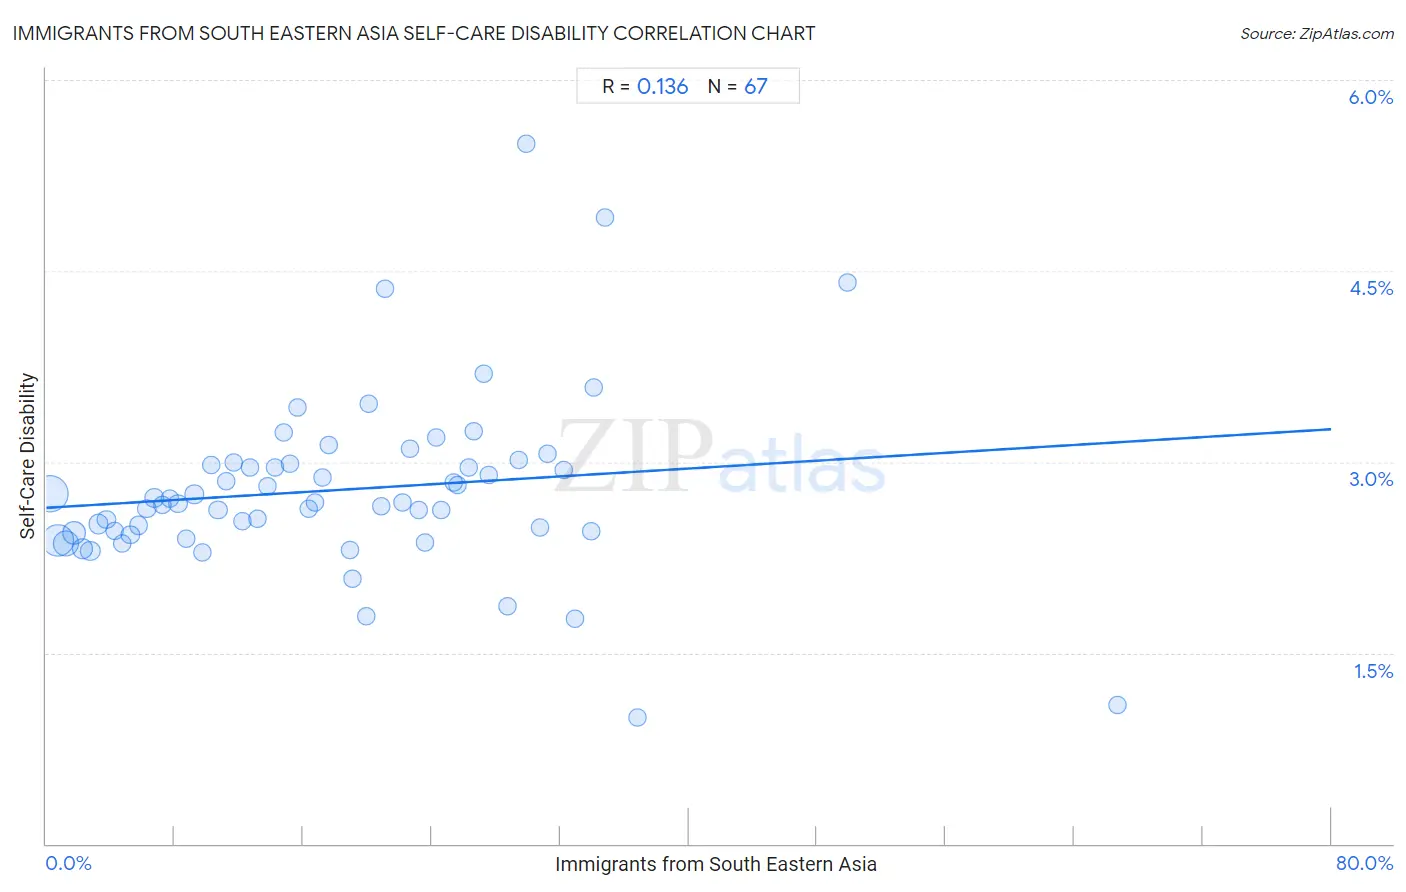
Immigrants from South Eastern Asia Self-Care Disability Correlation Chart
The statistical analysis conducted on geographies consisting of 511,565,632 people shows a poor positive correlation between the proportion of Immigrants from South Eastern Asia and percentage of population with self-care disability in the United States with a correlation coefficient (R) of 0.136 and weighted average of 2.5%. On average, for every 1% (one percent) increase in Immigrants from South Eastern Asia within a typical geography, there is an increase of 0.0077% in percentage of population with self-care disability.
It is essential to understand that the correlation between the percentage of Immigrants from South Eastern Asia and percentage of population with self-care disability does not imply a direct cause-and-effect relationship. It remains uncertain whether the presence of Immigrants from South Eastern Asia influences an upward or downward trend in the level of percentage of population with self-care disability within an area, or if Immigrants from South Eastern Asia simply ended up residing in those areas with higher or lower levels of percentage of population with self-care disability due to other factors.
Demographics Similar to Immigrants from South Eastern Asia by Self-Care Disability
In terms of self-care disability, the demographic groups most similar to Immigrants from South Eastern Asia are Immigrants from Western Africa (2.5%, a difference of 0.030%), Slovak (2.5%, a difference of 0.030%), Immigrants from Lebanon (2.5%, a difference of 0.050%), Immigrants from Bahamas (2.5%, a difference of 0.11%), and Immigrants from Ghana (2.5%, a difference of 0.18%).
| Demographics | Rating | Rank | Self-Care Disability |
| Immigrants from Germany | 17.9 /100 | #194 | Poor 2.5% |
| Immigrants from Southern Europe | 15.6 /100 | #195 | Poor 2.5% |
| Koreans | 15.5 /100 | #196 | Poor 2.5% |
| Crow | 15.2 /100 | #197 | Poor 2.5% |
| Immigrants | 15.0 /100 | #198 | Poor 2.5% |
| Immigrants from Ghana | 14.7 /100 | #199 | Poor 2.5% |
| Immigrants from Western Africa | 13.3 /100 | #200 | Poor 2.5% |
| Immigrants from South Eastern Asia | 12.9 /100 | #201 | Poor 2.5% |
| Slovaks | 12.6 /100 | #202 | Poor 2.5% |
| Immigrants from Lebanon | 12.4 /100 | #203 | Poor 2.5% |
| Immigrants from Bahamas | 11.9 /100 | #204 | Poor 2.5% |
| Immigrants from Russia | 11.0 /100 | #205 | Poor 2.5% |
| Alaskan Athabascans | 10.4 /100 | #206 | Poor 2.5% |
| French | 9.9 /100 | #207 | Tragic 2.5% |
| Central Americans | 8.7 /100 | #208 | Tragic 2.5% |
Immigrants from South Eastern Asia Self-Care Disability Correlation Summary
| Measurement | Immigrants from South Eastern Asia Data | Self-Care Disability Data |
| Minimum | 0.25% | 0.99% |
| Maximum | 66.7% | 5.5% |
| Range | 66.4% | 4.5% |
| Mean | 18.1% | 2.8% |
| Median | 16.7% | 2.7% |
| Interquartile 25% (IQ1) | 8.2% | 2.4% |
| Interquartile 75% (IQ3) | 26.3% | 3.0% |
| Interquartile Range (IQR) | 18.1% | 0.54% |
| Standard Deviation (Sample) | 12.4% | 0.71% |
| Standard Deviation (Population) | 12.4% | 0.70% |
Correlation Details
| Immigrants from South Eastern Asia Percentile | Sample Size | Self-Care Disability |
[ 0.0% - 0.5% ] 0.25% | 171,088,415 | 2.7% |
[ 0.5% - 1.0% ] 0.73% | 118,485,970 | 2.4% |
[ 1.0% - 1.5% ] 1.23% | 73,967,276 | 2.4% |
[ 1.5% - 2.0% ] 1.73% | 39,011,837 | 2.4% |
[ 2.0% - 2.5% ] 2.22% | 23,470,989 | 2.3% |
[ 2.5% - 3.0% ] 2.75% | 17,119,767 | 2.3% |
[ 3.0% - 3.5% ] 3.24% | 17,010,269 | 2.5% |
[ 3.5% - 4.0% ] 3.74% | 8,414,492 | 2.5% |
[ 4.0% - 4.5% ] 4.25% | 6,823,783 | 2.5% |
[ 4.5% - 5.0% ] 4.73% | 5,112,886 | 2.4% |
[ 5.0% - 5.5% ] 5.23% | 4,124,479 | 2.4% |
[ 5.5% - 6.0% ] 5.75% | 4,626,429 | 2.5% |
[ 6.0% - 6.5% ] 6.26% | 1,943,262 | 2.6% |
[ 6.5% - 7.0% ] 6.72% | 3,113,536 | 2.7% |
[ 7.0% - 7.5% ] 7.25% | 1,595,673 | 2.7% |
[ 7.5% - 8.0% ] 7.70% | 2,457,531 | 2.7% |
[ 8.0% - 8.5% ] 8.20% | 1,546,795 | 2.7% |
[ 8.5% - 9.0% ] 8.75% | 733,533 | 2.4% |
[ 9.0% - 9.5% ] 9.22% | 1,071,131 | 2.7% |
[ 9.5% - 10.0% ] 9.72% | 1,330,812 | 2.3% |
[ 10.0% - 10.5% ] 10.30% | 483,140 | 3.0% |
[ 10.5% - 11.0% ] 10.70% | 1,129,096 | 2.6% |
[ 11.0% - 11.5% ] 11.19% | 682,457 | 2.8% |
[ 11.5% - 12.0% ] 11.68% | 466,454 | 3.0% |
[ 12.0% - 12.5% ] 12.21% | 1,336,102 | 2.5% |
[ 12.5% - 13.0% ] 12.70% | 383,935 | 3.0% |
[ 13.0% - 13.5% ] 13.14% | 169,709 | 2.6% |
[ 13.5% - 14.0% ] 13.74% | 419,626 | 2.8% |
[ 14.0% - 14.5% ] 14.24% | 54,501 | 3.0% |
[ 14.5% - 15.0% ] 14.82% | 366,449 | 3.2% |
[ 15.0% - 15.5% ] 15.19% | 296,699 | 3.0% |
[ 15.5% - 16.0% ] 15.67% | 69,178 | 3.4% |
[ 16.0% - 16.5% ] 16.36% | 380,098 | 2.6% |
[ 16.5% - 17.0% ] 16.75% | 343,907 | 2.7% |
[ 17.0% - 17.5% ] 17.20% | 72,804 | 2.9% |
[ 17.5% - 18.0% ] 17.57% | 39,630 | 3.1% |
[ 18.5% - 19.0% ] 18.92% | 100,898 | 2.3% |
[ 19.0% - 19.5% ] 19.06% | 81,180 | 2.1% |
[ 19.5% - 20.0% ] 19.90% | 14,597 | 1.8% |
[ 20.0% - 20.5% ] 20.05% | 2,110 | 3.5% |
[ 20.5% - 21.0% ] 20.83% | 115,162 | 2.7% |
[ 21.0% - 21.5% ] 21.10% | 84,817 | 4.4% |
[ 22.0% - 22.5% ] 22.20% | 140,602 | 2.7% |
[ 22.5% - 23.0% ] 22.65% | 106,065 | 3.1% |
[ 23.0% - 23.5% ] 23.16% | 3,800 | 2.6% |
[ 23.5% - 24.0% ] 23.62% | 110,453 | 2.4% |
[ 24.0% - 24.5% ] 24.26% | 163,403 | 3.2% |
[ 24.5% - 25.0% ] 24.61% | 65,129 | 2.6% |
[ 25.0% - 25.5% ] 25.36% | 213,852 | 2.8% |
[ 25.5% - 26.0% ] 25.62% | 25,902 | 2.8% |
[ 26.0% - 26.5% ] 26.34% | 52,547 | 3.0% |
[ 26.5% - 27.0% ] 26.65% | 72,605 | 3.2% |
[ 27.0% - 27.5% ] 27.24% | 16,457 | 3.7% |
[ 27.5% - 28.0% ] 27.55% | 47,982 | 2.9% |
[ 28.5% - 29.0% ] 28.71% | 996 | 1.9% |
[ 29.0% - 29.5% ] 29.40% | 40,738 | 3.0% |
[ 29.5% - 30.0% ] 29.88% | 17,533 | 5.5% |
[ 30.5% - 31.0% ] 30.72% | 47,549 | 2.5% |
[ 31.0% - 31.5% ] 31.24% | 36,657 | 3.1% |
[ 32.0% - 32.5% ] 32.23% | 181,268 | 2.9% |
[ 32.5% - 33.0% ] 32.90% | 921 | 1.8% |
[ 33.5% - 34.0% ] 33.96% | 9,160 | 2.5% |
[ 34.0% - 34.5% ] 34.06% | 22,622 | 3.6% |
[ 34.5% - 35.0% ] 34.76% | 39,873 | 4.9% |
[ 36.5% - 37.0% ] 36.78% | 4,342 | 0.99% |
[ 49.5% - 50.0% ] 49.87% | 766 | 4.4% |
[ 66.5% - 67.0% ] 66.69% | 2,996 | 1.1% |