Immigrants from South Eastern Asia Disability Age Under 5
COMPARE
Immigrants from South Eastern Asia
Select to Compare
Disability Age Under 5
Immigrants from South Eastern Asia Disability Age Under 5
1.1%
DISABILITY | AGE UNDER 5
96.5/ 100
METRIC RATING
98th/ 347
METRIC RANK
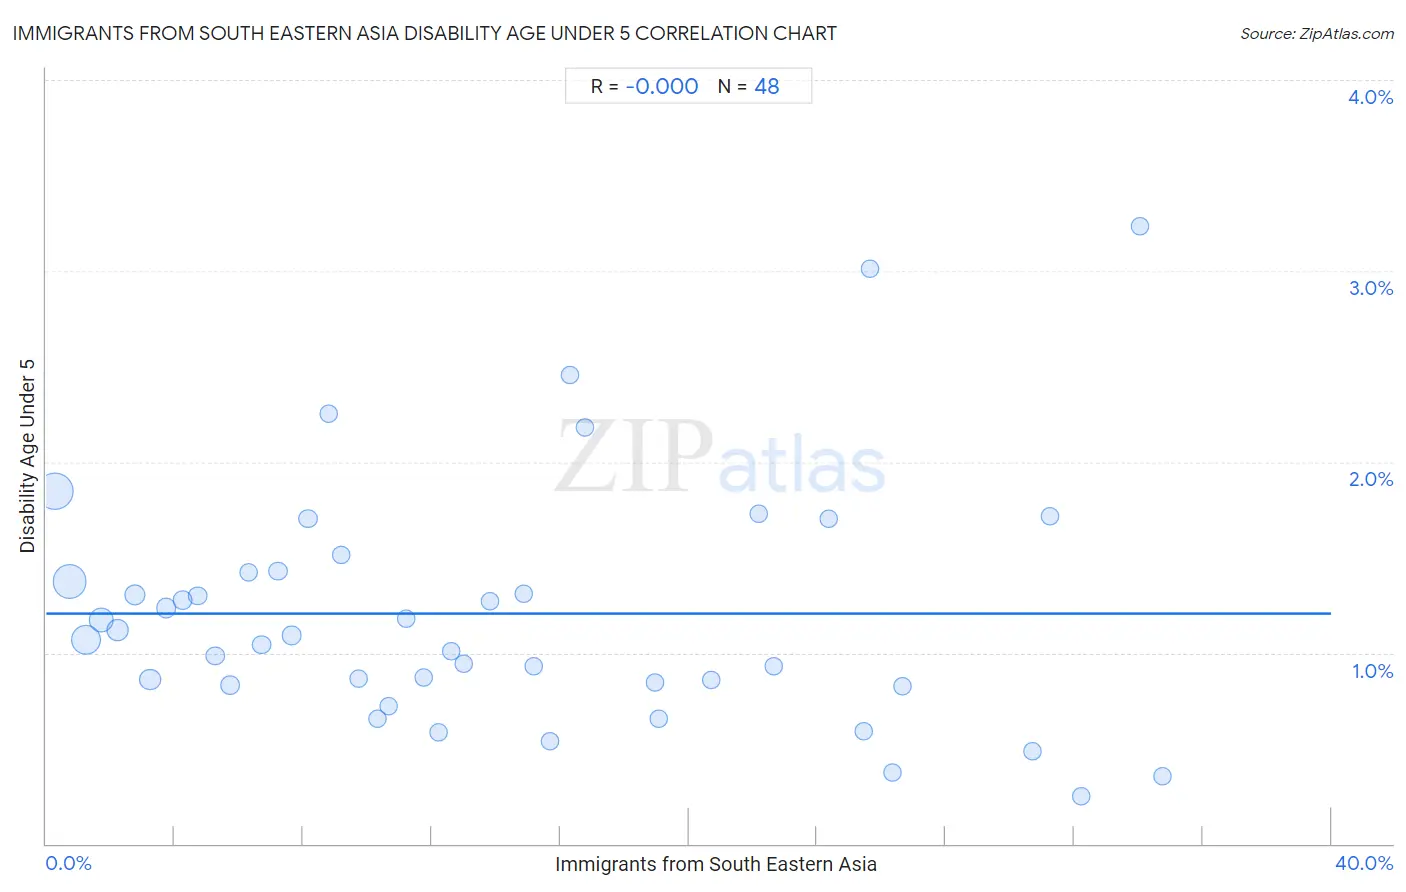
Immigrants from South Eastern Asia Disability Age Under 5 Correlation Chart
The statistical analysis conducted on geographies consisting of 251,042,035 people shows no correlation between the proportion of Immigrants from South Eastern Asia and percentage of population with a disability under the age of 5 in the United States with a correlation coefficient (R) of -0.000 and weighted average of 1.1%. On average, for every 1% (one percent) increase in Immigrants from South Eastern Asia within a typical geography, there is a decrease of 0.00000% in percentage of population with a disability under the age of 5.
It is essential to understand that the correlation between the percentage of Immigrants from South Eastern Asia and percentage of population with a disability under the age of 5 does not imply a direct cause-and-effect relationship. It remains uncertain whether the presence of Immigrants from South Eastern Asia influences an upward or downward trend in the level of percentage of population with a disability under the age of 5 within an area, or if Immigrants from South Eastern Asia simply ended up residing in those areas with higher or lower levels of percentage of population with a disability under the age of 5 due to other factors.
Demographics Similar to Immigrants from South Eastern Asia by Disability Age Under 5
In terms of disability age under 5, the demographic groups most similar to Immigrants from South Eastern Asia are Immigrants from Iraq (1.1%, a difference of 0.010%), Mongolian (1.1%, a difference of 0.11%), Dominican (1.1%, a difference of 0.13%), Nicaraguan (1.1%, a difference of 0.15%), and Immigrants from Moldova (1.1%, a difference of 0.22%).
| Demographics | Rating | Rank | Disability Age Under 5 |
| Albanians | 97.2 /100 | #91 | Exceptional 1.1% |
| Immigrants from Cuba | 97.0 /100 | #92 | Exceptional 1.1% |
| Spanish Americans | 96.9 /100 | #93 | Exceptional 1.1% |
| Sri Lankans | 96.8 /100 | #94 | Exceptional 1.1% |
| Immigrants from Moldova | 96.8 /100 | #95 | Exceptional 1.1% |
| Mongolians | 96.6 /100 | #96 | Exceptional 1.1% |
| Immigrants from Iraq | 96.5 /100 | #97 | Exceptional 1.1% |
| Immigrants from South Eastern Asia | 96.5 /100 | #98 | Exceptional 1.1% |
| Dominicans | 96.3 /100 | #99 | Exceptional 1.1% |
| Nicaraguans | 96.3 /100 | #100 | Exceptional 1.1% |
| Immigrants from Uganda | 96.1 /100 | #101 | Exceptional 1.1% |
| Immigrants from Morocco | 96.0 /100 | #102 | Exceptional 1.2% |
| Immigrants from Nicaragua | 96.0 /100 | #103 | Exceptional 1.2% |
| Indonesians | 95.9 /100 | #104 | Exceptional 1.2% |
| Immigrants from South Africa | 95.6 /100 | #105 | Exceptional 1.2% |
Immigrants from South Eastern Asia Disability Age Under 5 Correlation Summary
| Measurement | Immigrants from South Eastern Asia Data | Disability Age Under 5 Data |
| Minimum | 0.26% | 0.25% |
| Maximum | 34.8% | 3.2% |
| Range | 34.5% | 3.0% |
| Mean | 13.9% | 1.2% |
| Median | 12.0% | 1.1% |
| Interquartile 25% (IQ1) | 6.0% | 0.84% |
| Interquartile 75% (IQ3) | 21.5% | 1.4% |
| Interquartile Range (IQR) | 15.4% | 0.59% |
| Standard Deviation (Sample) | 9.8% | 0.63% |
| Standard Deviation (Population) | 9.7% | 0.63% |
Correlation Details
| Immigrants from South Eastern Asia Percentile | Sample Size | Disability Age Under 5 |
[ 0.0% - 0.5% ] 0.26% | 66,434,967 | 1.8% |
[ 0.5% - 1.0% ] 0.74% | 55,728,190 | 1.4% |
[ 1.0% - 1.5% ] 1.24% | 41,525,735 | 1.1% |
[ 1.5% - 2.0% ] 1.73% | 22,087,055 | 1.2% |
[ 2.0% - 2.5% ] 2.22% | 12,669,652 | 1.1% |
[ 2.5% - 3.0% ] 2.77% | 9,491,242 | 1.3% |
[ 3.0% - 3.5% ] 3.24% | 12,109,097 | 0.86% |
[ 3.5% - 4.0% ] 3.75% | 4,978,694 | 1.2% |
[ 4.0% - 4.5% ] 4.25% | 3,588,781 | 1.3% |
[ 4.5% - 5.0% ] 4.71% | 2,898,598 | 1.3% |
[ 5.0% - 5.5% ] 5.25% | 2,742,390 | 0.98% |
[ 5.5% - 6.0% ] 5.74% | 3,563,673 | 0.83% |
[ 6.0% - 6.5% ] 6.29% | 887,042 | 1.4% |
[ 6.5% - 7.0% ] 6.69% | 2,043,450 | 1.0% |
[ 7.0% - 7.5% ] 7.22% | 908,481 | 1.4% |
[ 7.5% - 8.0% ] 7.64% | 1,519,915 | 1.1% |
[ 8.0% - 8.5% ] 8.15% | 852,730 | 1.7% |
[ 8.5% - 9.0% ] 8.79% | 356,760 | 2.3% |
[ 9.0% - 9.5% ] 9.19% | 546,775 | 1.5% |
[ 9.5% - 10.0% ] 9.71% | 947,901 | 0.86% |
[ 10.0% - 10.5% ] 10.29% | 198,735 | 0.66% |
[ 10.5% - 11.0% ] 10.66% | 846,764 | 0.72% |
[ 11.0% - 11.5% ] 11.19% | 484,675 | 1.2% |
[ 11.5% - 12.0% ] 11.74% | 208,968 | 0.87% |
[ 12.0% - 12.5% ] 12.21% | 1,248,122 | 0.58% |
[ 12.5% - 13.0% ] 12.62% | 198,853 | 1.0% |
[ 13.0% - 13.5% ] 13.01% | 42,657 | 0.94% |
[ 13.5% - 14.0% ] 13.81% | 129,088 | 1.3% |
[ 14.5% - 15.0% ] 14.86% | 87,288 | 1.3% |
[ 15.0% - 15.5% ] 15.16% | 139,421 | 0.93% |
[ 15.5% - 16.0% ] 15.66% | 60,850 | 0.53% |
[ 16.0% - 16.5% ] 16.32% | 106,901 | 2.5% |
[ 16.5% - 17.0% ] 16.76% | 302,380 | 2.2% |
[ 18.5% - 19.0% ] 18.97% | 84,021 | 0.84% |
[ 19.0% - 19.5% ] 19.05% | 79,092 | 0.65% |
[ 20.5% - 21.0% ] 20.72% | 59,761 | 0.85% |
[ 22.0% - 22.5% ] 22.20% | 124,353 | 1.7% |
[ 22.5% - 23.0% ] 22.65% | 52,555 | 0.93% |
[ 24.0% - 24.5% ] 24.37% | 55,982 | 1.7% |
[ 25.0% - 25.5% ] 25.43% | 171,637 | 0.59% |
[ 25.5% - 26.0% ] 25.62% | 25,902 | 3.0% |
[ 26.0% - 26.5% ] 26.34% | 52,328 | 0.37% |
[ 26.5% - 27.0% ] 26.65% | 72,605 | 0.83% |
[ 30.5% - 31.0% ] 30.72% | 47,549 | 0.48% |
[ 31.0% - 31.5% ] 31.24% | 36,657 | 1.7% |
[ 32.0% - 32.5% ] 32.23% | 181,268 | 0.25% |
[ 34.0% - 34.5% ] 34.06% | 22,622 | 3.2% |
[ 34.5% - 35.0% ] 34.76% | 39,873 | 0.35% |