Immigrants from South Eastern Asia 4 or more Vehicles in Household
COMPARE
Immigrants from South Eastern Asia
Select to Compare
4 or more Vehicles in Household
Immigrants from South Eastern Asia 4 or more Vehicles in Household
8.2%
4+ VEHICLES AVAILABLE
100.0/ 100
METRIC RATING
29th/ 347
METRIC RANK
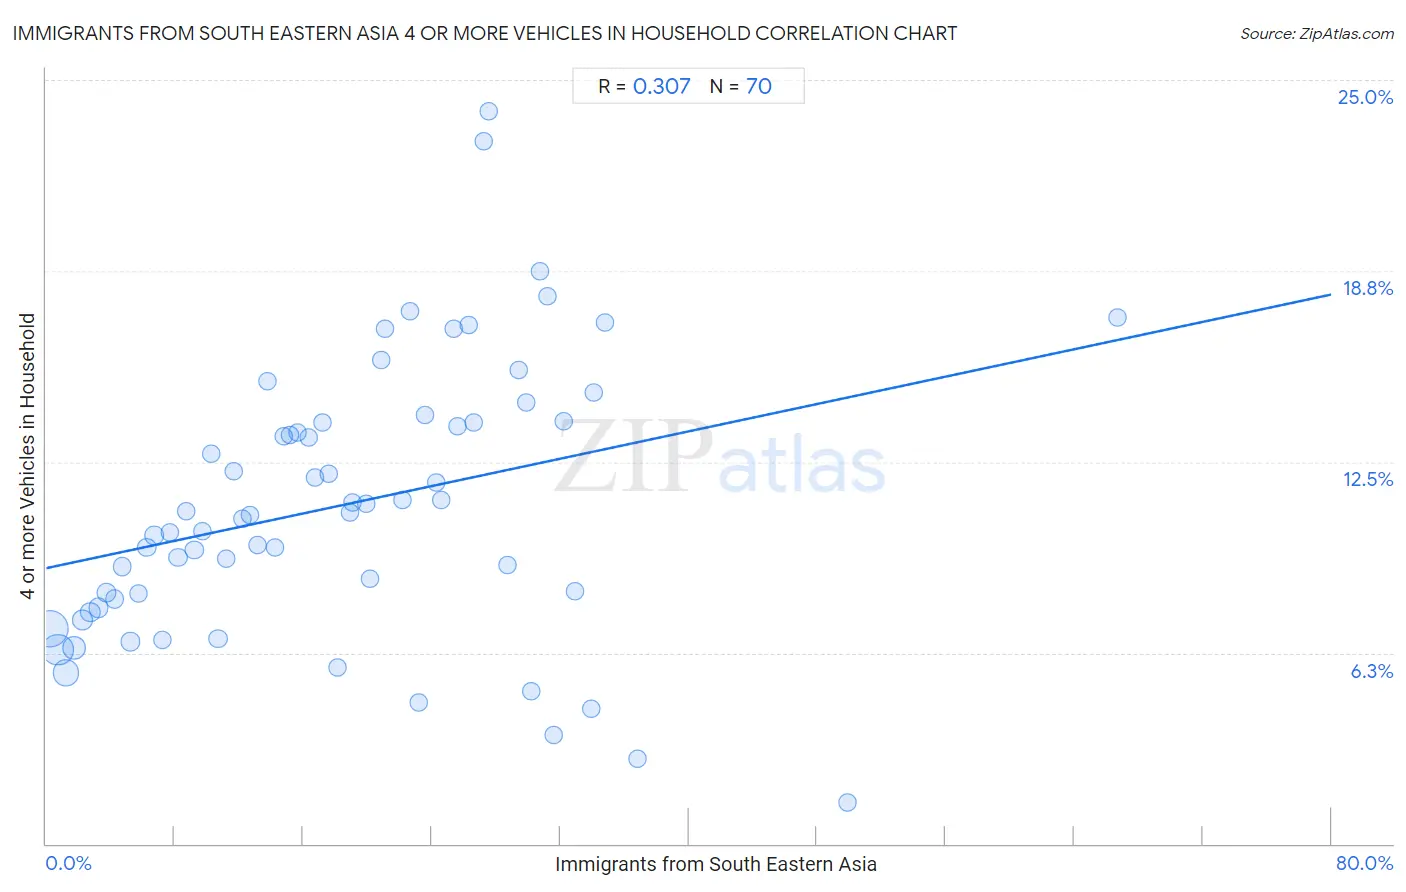
Immigrants from South Eastern Asia 4 or more Vehicles in Household Correlation Chart
The statistical analysis conducted on geographies consisting of 510,087,728 people shows a mild positive correlation between the proportion of Immigrants from South Eastern Asia and percentage of households with 4 or more vehicles available in the United States with a correlation coefficient (R) of 0.307 and weighted average of 8.2%. On average, for every 1% (one percent) increase in Immigrants from South Eastern Asia within a typical geography, there is an increase of 0.11% in percentage of households with 4 or more vehicles available.
It is essential to understand that the correlation between the percentage of Immigrants from South Eastern Asia and percentage of households with 4 or more vehicles available does not imply a direct cause-and-effect relationship. It remains uncertain whether the presence of Immigrants from South Eastern Asia influences an upward or downward trend in the level of percentage of households with 4 or more vehicles available within an area, or if Immigrants from South Eastern Asia simply ended up residing in those areas with higher or lower levels of percentage of households with 4 or more vehicles available due to other factors.
Demographics Similar to Immigrants from South Eastern Asia by 4 or more Vehicles in Household
In terms of 4 or more vehicles in household, the demographic groups most similar to Immigrants from South Eastern Asia are Navajo (8.2%, a difference of 0.030%), Native/Alaskan (8.2%, a difference of 0.43%), Cheyenne (8.3%, a difference of 0.66%), Marshallese (8.1%, a difference of 0.97%), and Yaqui (8.1%, a difference of 1.3%).
| Demographics | Rating | Rank | 4 or more Vehicles in Household |
| Immigrants from Vietnam | 100.0 /100 | #22 | Exceptional 8.6% |
| Immigrants from Philippines | 100.0 /100 | #23 | Exceptional 8.5% |
| Immigrants from Central America | 100.0 /100 | #24 | Exceptional 8.5% |
| Basques | 100.0 /100 | #25 | Exceptional 8.4% |
| Mexican American Indians | 100.0 /100 | #26 | Exceptional 8.4% |
| Sri Lankans | 100.0 /100 | #27 | Exceptional 8.4% |
| Cheyenne | 100.0 /100 | #28 | Exceptional 8.3% |
| Immigrants from South Eastern Asia | 100.0 /100 | #29 | Exceptional 8.2% |
| Navajo | 100.0 /100 | #30 | Exceptional 8.2% |
| Natives/Alaskans | 100.0 /100 | #31 | Exceptional 8.2% |
| Marshallese | 100.0 /100 | #32 | Exceptional 8.1% |
| Yaqui | 100.0 /100 | #33 | Exceptional 8.1% |
| Alaskan Athabascans | 100.0 /100 | #34 | Exceptional 8.1% |
| Guamanians/Chamorros | 100.0 /100 | #35 | Exceptional 8.1% |
| Norwegians | 100.0 /100 | #36 | Exceptional 8.0% |
Immigrants from South Eastern Asia 4 or more Vehicles in Household Correlation Summary
| Measurement | Immigrants from South Eastern Asia Data | 4 or more Vehicles in Household Data |
| Minimum | 0.25% | 1.4% |
| Maximum | 66.7% | 24.0% |
| Range | 66.4% | 22.6% |
| Mean | 18.5% | 11.1% |
| Median | 17.4% | 10.8% |
| Interquartile 25% (IQ1) | 8.7% | 8.0% |
| Interquartile 75% (IQ3) | 26.7% | 13.8% |
| Interquartile Range (IQR) | 17.9% | 5.8% |
| Standard Deviation (Sample) | 12.4% | 4.5% |
| Standard Deviation (Population) | 12.3% | 4.5% |
Correlation Details
| Immigrants from South Eastern Asia Percentile | Sample Size | 4 or more Vehicles in Household |
[ 0.0% - 0.5% ] 0.25% | 170,458,576 | 7.0% |
[ 0.5% - 1.0% ] 0.73% | 118,266,420 | 6.3% |
[ 1.0% - 1.5% ] 1.23% | 73,506,731 | 5.6% |
[ 1.5% - 2.0% ] 1.73% | 38,974,188 | 6.4% |
[ 2.0% - 2.5% ] 2.22% | 23,414,404 | 7.3% |
[ 2.5% - 3.0% ] 2.75% | 17,131,323 | 7.6% |
[ 3.0% - 3.5% ] 3.24% | 16,950,480 | 7.7% |
[ 3.5% - 4.0% ] 3.74% | 8,417,161 | 8.2% |
[ 4.0% - 4.5% ] 4.25% | 6,829,467 | 8.0% |
[ 4.5% - 5.0% ] 4.73% | 5,114,721 | 9.1% |
[ 5.0% - 5.5% ] 5.23% | 4,086,140 | 6.6% |
[ 5.5% - 6.0% ] 5.75% | 4,620,164 | 8.2% |
[ 6.0% - 6.5% ] 6.26% | 1,945,129 | 9.7% |
[ 6.5% - 7.0% ] 6.72% | 3,116,191 | 10.1% |
[ 7.0% - 7.5% ] 7.25% | 1,587,326 | 6.7% |
[ 7.5% - 8.0% ] 7.70% | 2,458,014 | 10.2% |
[ 8.0% - 8.5% ] 8.20% | 1,548,078 | 9.4% |
[ 8.5% - 9.0% ] 8.74% | 728,650 | 10.9% |
[ 9.0% - 9.5% ] 9.22% | 1,073,066 | 9.6% |
[ 9.5% - 10.0% ] 9.72% | 1,331,346 | 10.2% |
[ 10.0% - 10.5% ] 10.30% | 483,883 | 12.8% |
[ 10.5% - 11.0% ] 10.70% | 1,129,216 | 6.7% |
[ 11.0% - 11.5% ] 11.19% | 682,714 | 9.3% |
[ 11.5% - 12.0% ] 11.68% | 466,454 | 12.2% |
[ 12.0% - 12.5% ] 12.21% | 1,339,230 | 10.7% |
[ 12.5% - 13.0% ] 12.70% | 388,335 | 10.8% |
[ 13.0% - 13.5% ] 13.14% | 169,843 | 9.8% |
[ 13.5% - 14.0% ] 13.74% | 419,626 | 15.1% |
[ 14.0% - 14.5% ] 14.24% | 54,501 | 9.7% |
[ 14.5% - 15.0% ] 14.82% | 366,388 | 13.4% |
[ 15.0% - 15.5% ] 15.19% | 296,699 | 13.4% |
[ 15.5% - 16.0% ] 15.67% | 69,178 | 13.5% |
[ 16.0% - 16.5% ] 16.36% | 380,860 | 13.3% |
[ 16.5% - 17.0% ] 16.75% | 343,687 | 12.0% |
[ 17.0% - 17.5% ] 17.20% | 72,607 | 13.8% |
[ 17.5% - 18.0% ] 17.57% | 40,056 | 12.1% |
[ 18.0% - 18.5% ] 18.16% | 1,035 | 5.8% |
[ 18.5% - 19.0% ] 18.92% | 101,089 | 10.8% |
[ 19.0% - 19.5% ] 19.06% | 81,304 | 11.2% |
[ 19.5% - 20.0% ] 19.90% | 14,597 | 11.1% |
[ 20.0% - 20.5% ] 20.18% | 3,003 | 8.7% |
[ 20.5% - 21.0% ] 20.83% | 115,162 | 15.8% |
[ 21.0% - 21.5% ] 21.10% | 84,817 | 16.9% |
[ 22.0% - 22.5% ] 22.20% | 140,602 | 11.2% |
[ 22.5% - 23.0% ] 22.65% | 106,065 | 17.4% |
[ 23.0% - 23.5% ] 23.16% | 3,800 | 4.6% |
[ 23.5% - 24.0% ] 23.62% | 110,453 | 14.0% |
[ 24.0% - 24.5% ] 24.26% | 164,096 | 11.8% |
[ 24.5% - 25.0% ] 24.61% | 65,125 | 11.3% |
[ 25.0% - 25.5% ] 25.36% | 213,852 | 16.9% |
[ 25.5% - 26.0% ] 25.62% | 25,902 | 13.7% |
[ 26.0% - 26.5% ] 26.34% | 52,328 | 17.0% |
[ 26.5% - 27.0% ] 26.65% | 72,605 | 13.8% |
[ 27.0% - 27.5% ] 27.24% | 16,457 | 23.0% |
[ 27.5% - 28.0% ] 27.55% | 49,002 | 24.0% |
[ 28.5% - 29.0% ] 28.71% | 996 | 9.1% |
[ 29.0% - 29.5% ] 29.40% | 40,738 | 15.5% |
[ 29.5% - 30.0% ] 29.88% | 17,533 | 14.5% |
[ 30.0% - 30.5% ] 30.16% | 63 | 5.0% |
[ 30.5% - 31.0% ] 30.72% | 47,549 | 18.7% |
[ 31.0% - 31.5% ] 31.24% | 36,657 | 17.9% |
[ 31.5% - 32.0% ] 31.63% | 98 | 3.6% |
[ 32.0% - 32.5% ] 32.23% | 181,268 | 13.8% |
[ 32.5% - 33.0% ] 32.90% | 921 | 8.3% |
[ 33.5% - 34.0% ] 33.96% | 9,160 | 4.4% |
[ 34.0% - 34.5% ] 34.06% | 22,622 | 14.8% |
[ 34.5% - 35.0% ] 34.76% | 39,873 | 17.1% |
[ 36.5% - 37.0% ] 36.78% | 4,342 | 2.8% |
[ 49.5% - 50.0% ] 49.87% | 766 | 1.4% |
[ 66.5% - 67.0% ] 66.69% | 2,996 | 17.2% |