Immigrants from South Eastern Asia Married-Couple Family Poverty
COMPARE
Immigrants from South Eastern Asia
Select to Compare
Married-Couple Family Poverty
Immigrants from South Eastern Asia Married-Couple Family Poverty
5.1%
POVERTY | MARRIED-COUPLE FAMILIES
70.4/ 100
METRIC RATING
158th/ 347
METRIC RANK
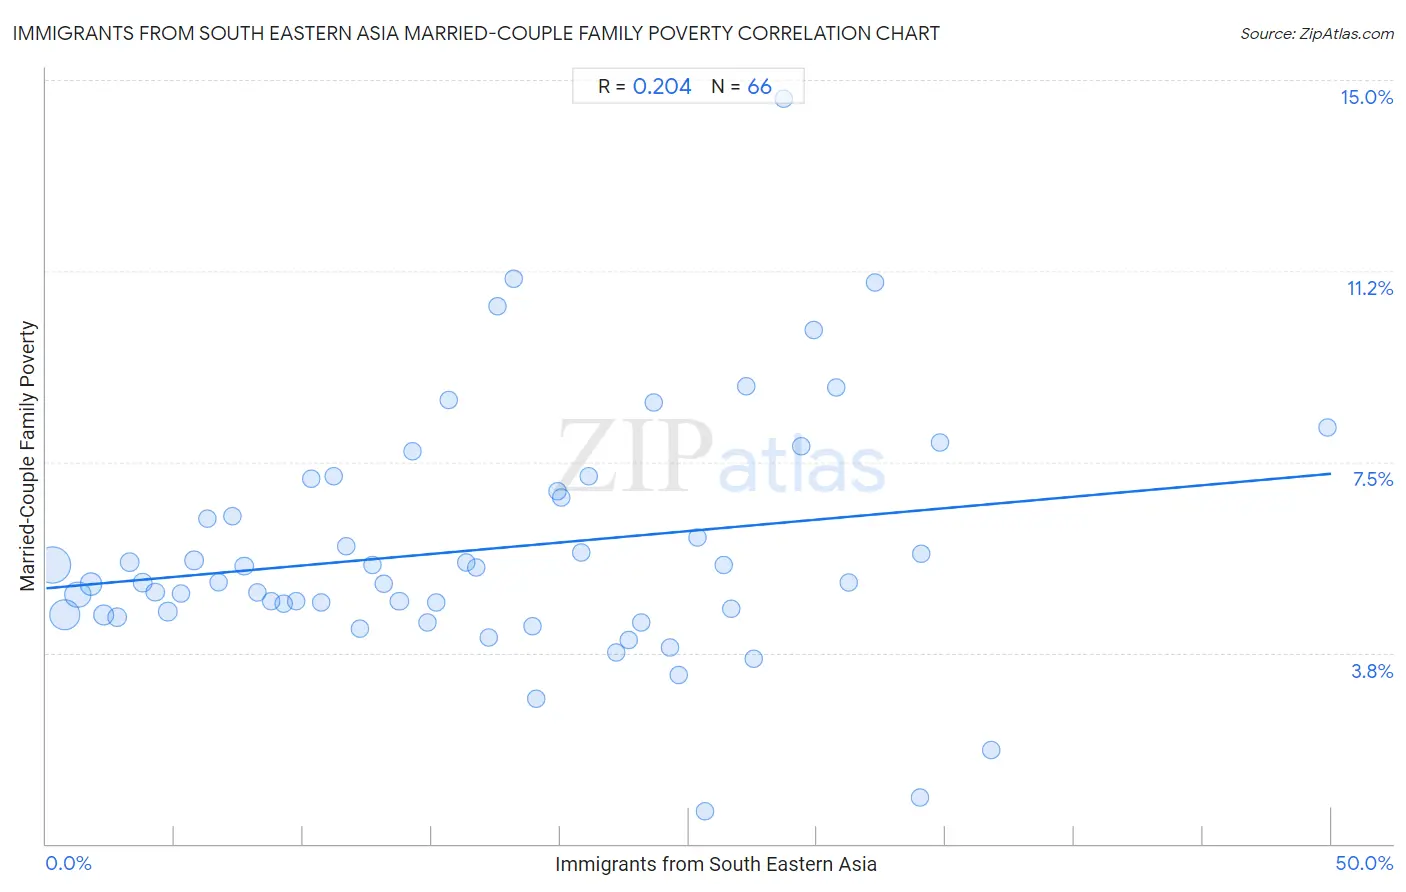
Immigrants from South Eastern Asia Married-Couple Family Poverty Correlation Chart
The statistical analysis conducted on geographies consisting of 504,926,469 people shows a weak positive correlation between the proportion of Immigrants from South Eastern Asia and poverty level among married-couple families in the United States with a correlation coefficient (R) of 0.204 and weighted average of 5.1%. On average, for every 1% (one percent) increase in Immigrants from South Eastern Asia within a typical geography, there is an increase of 0.045% in poverty level among married-couple families.
It is essential to understand that the correlation between the percentage of Immigrants from South Eastern Asia and poverty level among married-couple families does not imply a direct cause-and-effect relationship. It remains uncertain whether the presence of Immigrants from South Eastern Asia influences an upward or downward trend in the level of poverty level among married-couple families within an area, or if Immigrants from South Eastern Asia simply ended up residing in those areas with higher or lower levels of poverty level among married-couple families due to other factors.
Demographics Similar to Immigrants from South Eastern Asia by Married-Couple Family Poverty
In terms of married-couple family poverty, the demographic groups most similar to Immigrants from South Eastern Asia are Immigrants from Saudi Arabia (5.1%, a difference of 0.0%), Argentinean (5.1%, a difference of 0.050%), Pennsylvania German (5.1%, a difference of 0.26%), Sri Lankan (5.1%, a difference of 0.27%), and Immigrants from Ethiopia (5.1%, a difference of 0.31%).
| Demographics | Rating | Rank | Married-Couple Family Poverty |
| Immigrants from Cameroon | 77.3 /100 | #151 | Good 5.0% |
| Albanians | 77.2 /100 | #152 | Good 5.0% |
| Immigrants from Kuwait | 76.3 /100 | #153 | Good 5.0% |
| Delaware | 73.7 /100 | #154 | Good 5.1% |
| Immigrants from Ethiopia | 72.4 /100 | #155 | Good 5.1% |
| Sri Lankans | 72.2 /100 | #156 | Good 5.1% |
| Argentineans | 70.7 /100 | #157 | Good 5.1% |
| Immigrants from South Eastern Asia | 70.4 /100 | #158 | Good 5.1% |
| Immigrants from Saudi Arabia | 70.3 /100 | #159 | Good 5.1% |
| Pennsylvania Germans | 68.5 /100 | #160 | Good 5.1% |
| Ethiopians | 68.1 /100 | #161 | Good 5.1% |
| Immigrants from Jordan | 66.5 /100 | #162 | Good 5.1% |
| Sierra Leoneans | 64.1 /100 | #163 | Good 5.1% |
| Hawaiians | 62.3 /100 | #164 | Good 5.1% |
| Immigrants from Malaysia | 62.2 /100 | #165 | Good 5.1% |
Immigrants from South Eastern Asia Married-Couple Family Poverty Correlation Summary
| Measurement | Immigrants from South Eastern Asia Data | Married-Couple Family Poverty Data |
| Minimum | 0.25% | 0.63% |
| Maximum | 49.9% | 14.6% |
| Range | 49.6% | 14.0% |
| Mean | 17.2% | 5.8% |
| Median | 16.6% | 5.1% |
| Interquartile 25% (IQ1) | 8.2% | 4.5% |
| Interquartile 75% (IQ3) | 25.4% | 6.9% |
| Interquartile Range (IQR) | 17.2% | 2.4% |
| Standard Deviation (Sample) | 10.8% | 2.4% |
| Standard Deviation (Population) | 10.7% | 2.4% |
Correlation Details
| Immigrants from South Eastern Asia Percentile | Sample Size | Married-Couple Family Poverty |
[ 0.0% - 0.5% ] 0.25% | 168,350,694 | 5.5% |
[ 0.5% - 1.0% ] 0.73% | 116,722,437 | 4.5% |
[ 1.0% - 1.5% ] 1.23% | 73,136,159 | 4.9% |
[ 1.5% - 2.0% ] 1.73% | 38,542,149 | 5.1% |
[ 2.0% - 2.5% ] 2.22% | 23,287,013 | 4.5% |
[ 2.5% - 3.0% ] 2.76% | 16,930,423 | 4.5% |
[ 3.0% - 3.5% ] 3.24% | 16,861,661 | 5.5% |
[ 3.5% - 4.0% ] 3.74% | 8,331,487 | 5.1% |
[ 4.0% - 4.5% ] 4.25% | 6,803,244 | 4.9% |
[ 4.5% - 5.0% ] 4.73% | 5,088,687 | 4.6% |
[ 5.0% - 5.5% ] 5.23% | 4,089,125 | 4.9% |
[ 5.5% - 6.0% ] 5.75% | 4,606,914 | 5.6% |
[ 6.0% - 6.5% ] 6.26% | 1,935,960 | 6.4% |
[ 6.5% - 7.0% ] 6.72% | 3,094,046 | 5.1% |
[ 7.0% - 7.5% ] 7.25% | 1,589,652 | 6.4% |
[ 7.5% - 8.0% ] 7.70% | 2,447,580 | 5.4% |
[ 8.0% - 8.5% ] 8.20% | 1,532,859 | 4.9% |
[ 8.5% - 9.0% ] 8.75% | 715,201 | 4.8% |
[ 9.0% - 9.5% ] 9.22% | 1,071,823 | 4.7% |
[ 9.5% - 10.0% ] 9.72% | 1,314,692 | 4.8% |
[ 10.0% - 10.5% ] 10.30% | 476,594 | 7.2% |
[ 10.5% - 11.0% ] 10.70% | 1,128,095 | 4.7% |
[ 11.0% - 11.5% ] 11.19% | 680,133 | 7.2% |
[ 11.5% - 12.0% ] 11.68% | 466,454 | 5.8% |
[ 12.0% - 12.5% ] 12.21% | 1,336,057 | 4.2% |
[ 12.5% - 13.0% ] 12.70% | 387,682 | 5.5% |
[ 13.0% - 13.5% ] 13.13% | 163,536 | 5.1% |
[ 13.5% - 14.0% ] 13.74% | 419,626 | 4.8% |
[ 14.0% - 14.5% ] 14.23% | 53,385 | 7.7% |
[ 14.5% - 15.0% ] 14.82% | 366,449 | 4.3% |
[ 15.0% - 15.5% ] 15.19% | 294,395 | 4.7% |
[ 15.5% - 16.0% ] 15.67% | 68,159 | 8.7% |
[ 16.0% - 16.5% ] 16.36% | 379,408 | 5.5% |
[ 16.5% - 17.0% ] 16.75% | 343,907 | 5.4% |
[ 17.0% - 17.5% ] 17.20% | 66,122 | 4.1% |
[ 17.5% - 18.0% ] 17.56% | 37,340 | 10.6% |
[ 18.0% - 18.5% ] 18.19% | 1,127 | 11.1% |
[ 18.5% - 19.0% ] 18.92% | 101,089 | 4.3% |
[ 19.0% - 19.5% ] 19.06% | 81,180 | 2.8% |
[ 19.5% - 20.0% ] 19.91% | 13,765 | 6.9% |
[ 20.0% - 20.5% ] 20.05% | 2,110 | 6.8% |
[ 20.5% - 21.0% ] 20.83% | 115,224 | 5.7% |
[ 21.0% - 21.5% ] 21.10% | 84,817 | 7.2% |
[ 22.0% - 22.5% ] 22.20% | 140,602 | 3.7% |
[ 22.5% - 23.0% ] 22.64% | 102,104 | 4.0% |
[ 23.0% - 23.5% ] 23.16% | 3,800 | 4.3% |
[ 23.5% - 24.0% ] 23.62% | 110,453 | 8.7% |
[ 24.0% - 24.5% ] 24.26% | 163,906 | 3.9% |
[ 24.5% - 25.0% ] 24.61% | 65,345 | 3.3% |
[ 25.0% - 25.5% ] 25.36% | 213,356 | 6.0% |
[ 25.5% - 26.0% ] 25.62% | 25,902 | 0.63% |
[ 26.0% - 26.5% ] 26.34% | 52,328 | 5.5% |
[ 26.5% - 27.0% ] 26.65% | 72,605 | 4.6% |
[ 27.0% - 27.5% ] 27.25% | 15,167 | 9.0% |
[ 27.5% - 28.0% ] 27.55% | 47,982 | 3.6% |
[ 28.5% - 29.0% ] 28.71% | 996 | 14.6% |
[ 29.0% - 29.5% ] 29.40% | 40,738 | 7.8% |
[ 29.5% - 30.0% ] 29.87% | 16,072 | 10.1% |
[ 30.5% - 31.0% ] 30.72% | 47,549 | 9.0% |
[ 31.0% - 31.5% ] 31.24% | 36,657 | 5.1% |
[ 32.0% - 32.5% ] 32.23% | 181,268 | 11.0% |
[ 33.5% - 34.0% ] 33.98% | 3,576 | 0.90% |
[ 34.0% - 34.5% ] 34.06% | 22,622 | 5.7% |
[ 34.5% - 35.0% ] 34.76% | 39,873 | 7.9% |
[ 36.5% - 37.0% ] 36.78% | 4,342 | 1.8% |
[ 49.5% - 50.0% ] 49.87% | 766 | 8.2% |