Immigrants from South Central Asia Married-Couple Family Poverty
COMPARE
Immigrants from South Central Asia
Select to Compare
Married-Couple Family Poverty
Immigrants from South Central Asia Married-Couple Family Poverty
4.3%
POVERTY | MARRIED-COUPLE FAMILIES
99.8/ 100
METRIC RATING
47th/ 347
METRIC RANK
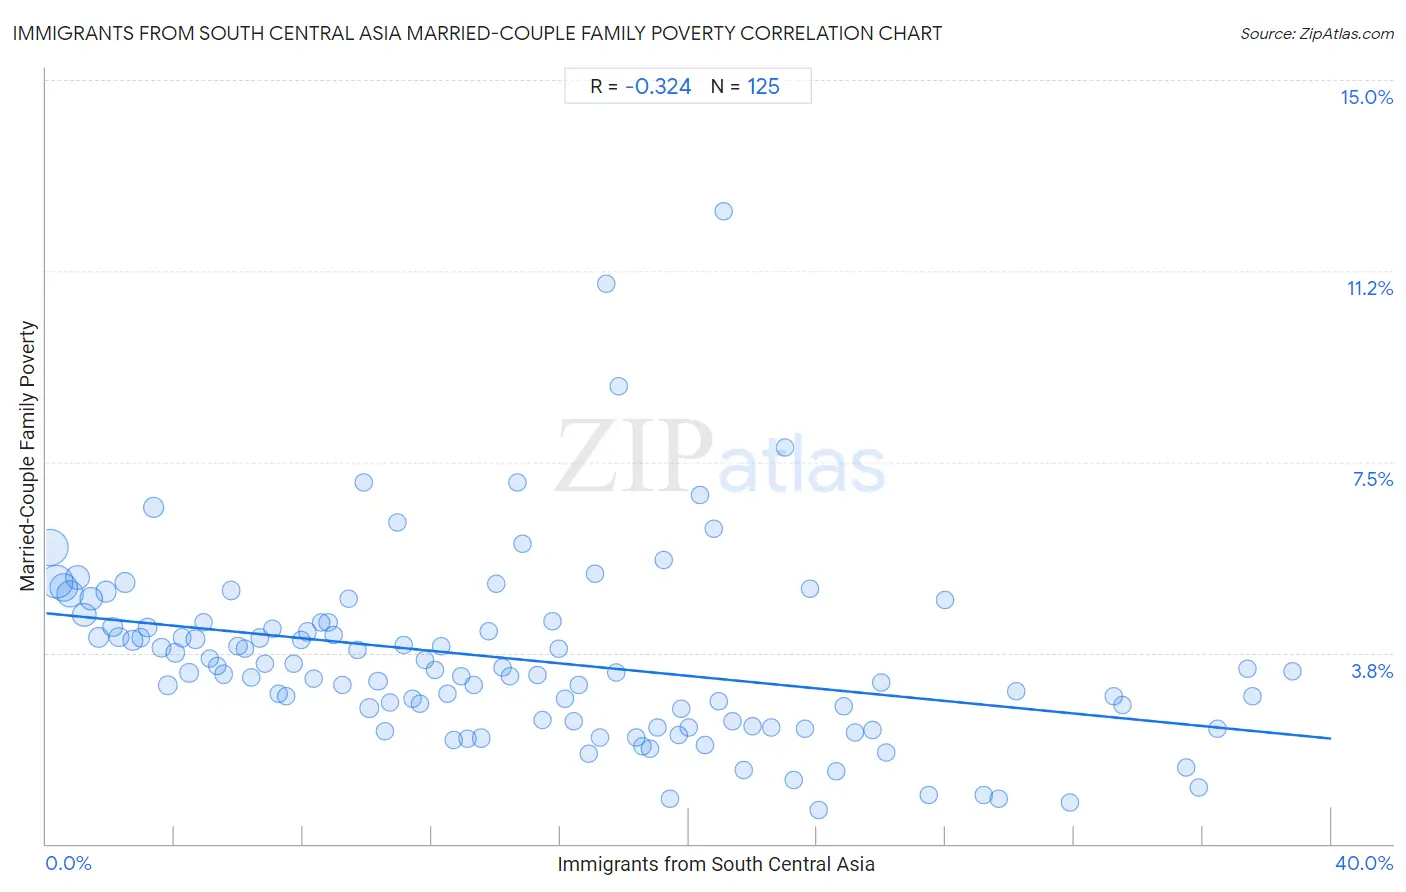
Immigrants from South Central Asia Married-Couple Family Poverty Correlation Chart
The statistical analysis conducted on geographies consisting of 466,887,426 people shows a mild negative correlation between the proportion of Immigrants from South Central Asia and poverty level among married-couple families in the United States with a correlation coefficient (R) of -0.324 and weighted average of 4.3%. On average, for every 1% (one percent) increase in Immigrants from South Central Asia within a typical geography, there is a decrease of 0.061% in poverty level among married-couple families.
It is essential to understand that the correlation between the percentage of Immigrants from South Central Asia and poverty level among married-couple families does not imply a direct cause-and-effect relationship. It remains uncertain whether the presence of Immigrants from South Central Asia influences an upward or downward trend in the level of poverty level among married-couple families within an area, or if Immigrants from South Central Asia simply ended up residing in those areas with higher or lower levels of poverty level among married-couple families due to other factors.
Demographics Similar to Immigrants from South Central Asia by Married-Couple Family Poverty
In terms of married-couple family poverty, the demographic groups most similar to Immigrants from South Central Asia are Australian (4.3%, a difference of 0.070%), British (4.3%, a difference of 0.12%), Serbian (4.3%, a difference of 0.14%), Turkish (4.3%, a difference of 0.15%), and Immigrants from Japan (4.3%, a difference of 0.16%).
| Demographics | Rating | Rank | Married-Couple Family Poverty |
| French Canadians | 99.8 /100 | #40 | Exceptional 4.2% |
| Northern Europeans | 99.8 /100 | #41 | Exceptional 4.3% |
| Scottish | 99.8 /100 | #42 | Exceptional 4.3% |
| Swiss | 99.8 /100 | #43 | Exceptional 4.3% |
| Immigrants from Japan | 99.8 /100 | #44 | Exceptional 4.3% |
| Serbians | 99.8 /100 | #45 | Exceptional 4.3% |
| British | 99.8 /100 | #46 | Exceptional 4.3% |
| Immigrants from South Central Asia | 99.8 /100 | #47 | Exceptional 4.3% |
| Australians | 99.7 /100 | #48 | Exceptional 4.3% |
| Turks | 99.7 /100 | #49 | Exceptional 4.3% |
| Burmese | 99.7 /100 | #50 | Exceptional 4.3% |
| Immigrants from Lithuania | 99.7 /100 | #51 | Exceptional 4.3% |
| Russians | 99.7 /100 | #52 | Exceptional 4.3% |
| Welsh | 99.7 /100 | #53 | Exceptional 4.3% |
| Austrians | 99.7 /100 | #54 | Exceptional 4.3% |
Immigrants from South Central Asia Married-Couple Family Poverty Correlation Summary
| Measurement | Immigrants from South Central Asia Data | Married-Couple Family Poverty Data |
| Minimum | 0.11% | 0.66% |
| Maximum | 38.8% | 12.4% |
| Range | 38.7% | 11.8% |
| Mean | 14.6% | 3.6% |
| Median | 13.6% | 3.4% |
| Interquartile 25% (IQ1) | 6.7% | 2.4% |
| Interquartile 75% (IQ3) | 20.8% | 4.3% |
| Interquartile Range (IQR) | 14.1% | 1.9% |
| Standard Deviation (Sample) | 9.7% | 1.8% |
| Standard Deviation (Population) | 9.6% | 1.8% |
Correlation Details
| Immigrants from South Central Asia Percentile | Sample Size | Married-Couple Family Poverty |
[ 0.0% - 0.5% ] 0.11% | 89,747,998 | 5.8% |
[ 0.0% - 0.5% ] 0.32% | 67,845,985 | 5.1% |
[ 0.5% - 1.0% ] 0.54% | 48,344,898 | 5.0% |
[ 0.5% - 1.0% ] 0.76% | 40,818,174 | 4.9% |
[ 0.5% - 1.0% ] 0.97% | 29,664,821 | 5.2% |
[ 1.0% - 1.5% ] 1.18% | 24,712,833 | 4.5% |
[ 1.0% - 1.5% ] 1.41% | 23,993,963 | 4.8% |
[ 1.5% - 2.0% ] 1.63% | 12,794,181 | 4.1% |
[ 1.5% - 2.0% ] 1.85% | 13,658,156 | 5.0% |
[ 2.0% - 2.5% ] 2.06% | 10,143,342 | 4.3% |
[ 2.0% - 2.5% ] 2.27% | 9,701,165 | 4.1% |
[ 2.0% - 2.5% ] 2.45% | 11,654,976 | 5.1% |
[ 2.5% - 3.0% ] 2.70% | 8,668,792 | 4.0% |
[ 2.5% - 3.0% ] 2.94% | 4,542,952 | 4.0% |
[ 3.0% - 3.5% ] 3.15% | 5,746,971 | 4.2% |
[ 3.0% - 3.5% ] 3.34% | 13,183,835 | 6.6% |
[ 3.5% - 4.0% ] 3.58% | 3,866,983 | 3.9% |
[ 3.5% - 4.0% ] 3.79% | 3,153,156 | 3.1% |
[ 4.0% - 4.5% ] 4.01% | 3,183,081 | 3.7% |
[ 4.0% - 4.5% ] 4.22% | 3,440,404 | 4.0% |
[ 4.0% - 4.5% ] 4.45% | 2,526,979 | 3.4% |
[ 4.5% - 5.0% ] 4.65% | 1,959,062 | 4.0% |
[ 4.5% - 5.0% ] 4.89% | 1,932,567 | 4.3% |
[ 5.0% - 5.5% ] 5.09% | 2,199,434 | 3.6% |
[ 5.0% - 5.5% ] 5.32% | 1,851,539 | 3.5% |
[ 5.5% - 6.0% ] 5.53% | 1,142,327 | 3.3% |
[ 5.5% - 6.0% ] 5.75% | 1,399,225 | 5.0% |
[ 5.5% - 6.0% ] 5.97% | 1,320,117 | 3.9% |
[ 6.0% - 6.5% ] 6.19% | 1,044,672 | 3.8% |
[ 6.0% - 6.5% ] 6.37% | 720,063 | 3.3% |
[ 6.5% - 7.0% ] 6.64% | 1,855,806 | 4.0% |
[ 6.5% - 7.0% ] 6.82% | 739,248 | 3.5% |
[ 7.0% - 7.5% ] 7.06% | 742,337 | 4.2% |
[ 7.0% - 7.5% ] 7.25% | 465,195 | 3.0% |
[ 7.0% - 7.5% ] 7.48% | 588,759 | 2.9% |
[ 7.5% - 8.0% ] 7.69% | 546,112 | 3.5% |
[ 7.5% - 8.0% ] 7.94% | 542,398 | 4.0% |
[ 8.0% - 8.5% ] 8.13% | 392,474 | 4.2% |
[ 8.0% - 8.5% ] 8.34% | 1,133,184 | 3.3% |
[ 8.5% - 9.0% ] 8.55% | 831,209 | 4.4% |
[ 8.5% - 9.0% ] 8.77% | 701,490 | 4.3% |
[ 8.5% - 9.0% ] 8.96% | 391,578 | 4.1% |
[ 9.0% - 9.5% ] 9.22% | 713,997 | 3.1% |
[ 9.0% - 9.5% ] 9.41% | 355,841 | 4.8% |
[ 9.5% - 10.0% ] 9.67% | 556,057 | 3.8% |
[ 9.5% - 10.0% ] 9.86% | 409,012 | 7.1% |
[ 10.0% - 10.5% ] 10.06% | 516,387 | 2.7% |
[ 10.0% - 10.5% ] 10.33% | 806,223 | 3.2% |
[ 10.5% - 11.0% ] 10.53% | 287,221 | 2.2% |
[ 10.5% - 11.0% ] 10.72% | 170,213 | 2.8% |
[ 10.5% - 11.0% ] 10.92% | 616,020 | 6.3% |
[ 11.0% - 11.5% ] 11.14% | 152,451 | 3.9% |
[ 11.0% - 11.5% ] 11.40% | 149,848 | 2.8% |
[ 11.5% - 12.0% ] 11.62% | 610,048 | 2.8% |
[ 11.5% - 12.0% ] 11.79% | 526,869 | 3.6% |
[ 12.0% - 12.5% ] 12.09% | 258,290 | 3.4% |
[ 12.0% - 12.5% ] 12.29% | 267,554 | 3.9% |
[ 12.0% - 12.5% ] 12.48% | 467,532 | 2.9% |
[ 12.5% - 13.0% ] 12.67% | 251,228 | 2.0% |
[ 12.5% - 13.0% ] 12.93% | 180,175 | 3.3% |
[ 13.0% - 13.5% ] 13.13% | 179,136 | 2.1% |
[ 13.0% - 13.5% ] 13.30% | 222,095 | 3.1% |
[ 13.5% - 14.0% ] 13.55% | 181,618 | 2.1% |
[ 13.5% - 14.0% ] 13.77% | 410,337 | 4.2% |
[ 13.5% - 14.0% ] 14.00% | 45,921 | 5.1% |
[ 14.0% - 14.5% ] 14.20% | 63,149 | 3.5% |
[ 14.0% - 14.5% ] 14.44% | 134,788 | 3.3% |
[ 14.5% - 15.0% ] 14.66% | 332,921 | 7.1% |
[ 14.5% - 15.0% ] 14.82% | 63,656 | 5.9% |
[ 15.0% - 15.5% ] 15.29% | 77,067 | 3.3% |
[ 15.0% - 15.5% ] 15.45% | 258,935 | 2.4% |
[ 15.5% - 16.0% ] 15.74% | 159,820 | 4.4% |
[ 15.5% - 16.0% ] 15.95% | 128,568 | 3.8% |
[ 16.0% - 16.5% ] 16.16% | 254,593 | 2.9% |
[ 16.0% - 16.5% ] 16.42% | 112,519 | 2.4% |
[ 16.5% - 17.0% ] 16.56% | 113,686 | 3.1% |
[ 16.5% - 17.0% ] 16.89% | 180,194 | 1.8% |
[ 17.0% - 17.5% ] 17.08% | 22,030 | 5.3% |
[ 17.0% - 17.5% ] 17.23% | 272,834 | 2.1% |
[ 17.0% - 17.5% ] 17.44% | 16,679 | 11.0% |
[ 17.5% - 18.0% ] 17.73% | 215,024 | 3.4% |
[ 17.5% - 18.0% ] 17.83% | 131,679 | 9.0% |
[ 18.0% - 18.5% ] 18.37% | 6,272 | 2.1% |
[ 18.5% - 19.0% ] 18.56% | 30,149 | 1.9% |
[ 18.5% - 19.0% ] 18.81% | 153,344 | 1.9% |
[ 19.0% - 19.5% ] 19.03% | 129,604 | 2.3% |
[ 19.0% - 19.5% ] 19.20% | 149,814 | 5.6% |
[ 19.0% - 19.5% ] 19.42% | 11,603 | 0.89% |
[ 19.5% - 20.0% ] 19.69% | 13,297 | 2.1% |
[ 19.5% - 20.0% ] 19.77% | 19,017 | 2.6% |
[ 20.0% - 20.5% ] 20.01% | 51,902 | 2.3% |
[ 20.0% - 20.5% ] 20.33% | 22,831 | 6.8% |
[ 20.5% - 21.0% ] 20.51% | 68,761 | 1.9% |
[ 20.5% - 21.0% ] 20.77% | 32,559 | 6.2% |
[ 20.5% - 21.0% ] 20.92% | 14,067 | 2.8% |
[ 21.0% - 21.5% ] 21.09% | 127,930 | 12.4% |
[ 21.0% - 21.5% ] 21.36% | 210,788 | 2.4% |
[ 21.5% - 22.0% ] 21.72% | 24,229 | 1.4% |
[ 21.5% - 22.0% ] 21.98% | 74,839 | 2.3% |
[ 22.5% - 23.0% ] 22.57% | 228,795 | 2.3% |
[ 22.5% - 23.0% ] 23.00% | 64,268 | 7.8% |
[ 23.0% - 23.5% ] 23.28% | 37,671 | 1.3% |
[ 23.5% - 24.0% ] 23.60% | 88,402 | 2.3% |
[ 23.5% - 24.0% ] 23.79% | 50,125 | 5.0% |
[ 24.0% - 24.5% ] 24.06% | 22,796 | 0.66% |
[ 24.5% - 25.0% ] 24.58% | 38,567 | 1.4% |
[ 24.5% - 25.0% ] 24.81% | 37,194 | 2.7% |
[ 25.0% - 25.5% ] 25.19% | 53,464 | 2.2% |
[ 25.5% - 26.0% ] 25.72% | 5,206 | 2.2% |
[ 25.5% - 26.0% ] 25.98% | 42,760 | 3.2% |
[ 26.0% - 26.5% ] 26.16% | 29,756 | 1.8% |
[ 27.0% - 27.5% ] 27.46% | 5,018 | 0.97% |
[ 27.5% - 28.0% ] 27.96% | 15,702 | 4.8% |
[ 29.0% - 29.5% ] 29.17% | 3,695 | 0.97% |
[ 29.5% - 30.0% ] 29.66% | 5,867 | 0.88% |
[ 30.0% - 30.5% ] 30.21% | 18,068 | 3.0% |
[ 31.5% - 32.0% ] 31.85% | 16,722 | 0.82% |
[ 33.0% - 33.5% ] 33.22% | 20,264 | 2.9% |
[ 33.5% - 34.0% ] 33.51% | 37,689 | 2.7% |
[ 35.0% - 35.5% ] 35.50% | 20,693 | 1.5% |
[ 35.5% - 36.0% ] 35.86% | 15,585 | 1.1% |
[ 36.0% - 36.5% ] 36.48% | 2,300 | 2.2% |
[ 37.0% - 37.5% ] 37.40% | 44,570 | 3.4% |
[ 37.5% - 38.0% ] 37.56% | 39,565 | 2.9% |
[ 38.5% - 39.0% ] 38.78% | 37,022 | 3.4% |