Immigrants from South Central Asia Married-couple Households
COMPARE
Immigrants from South Central Asia
Select to Compare
Married-couple Households
Immigrants from South Central Asia Married-couple Households
50.6%
MARRIED-COUPLE HOUSEHOLDS
100.0/ 100
METRIC RATING
8th/ 347
METRIC RANK
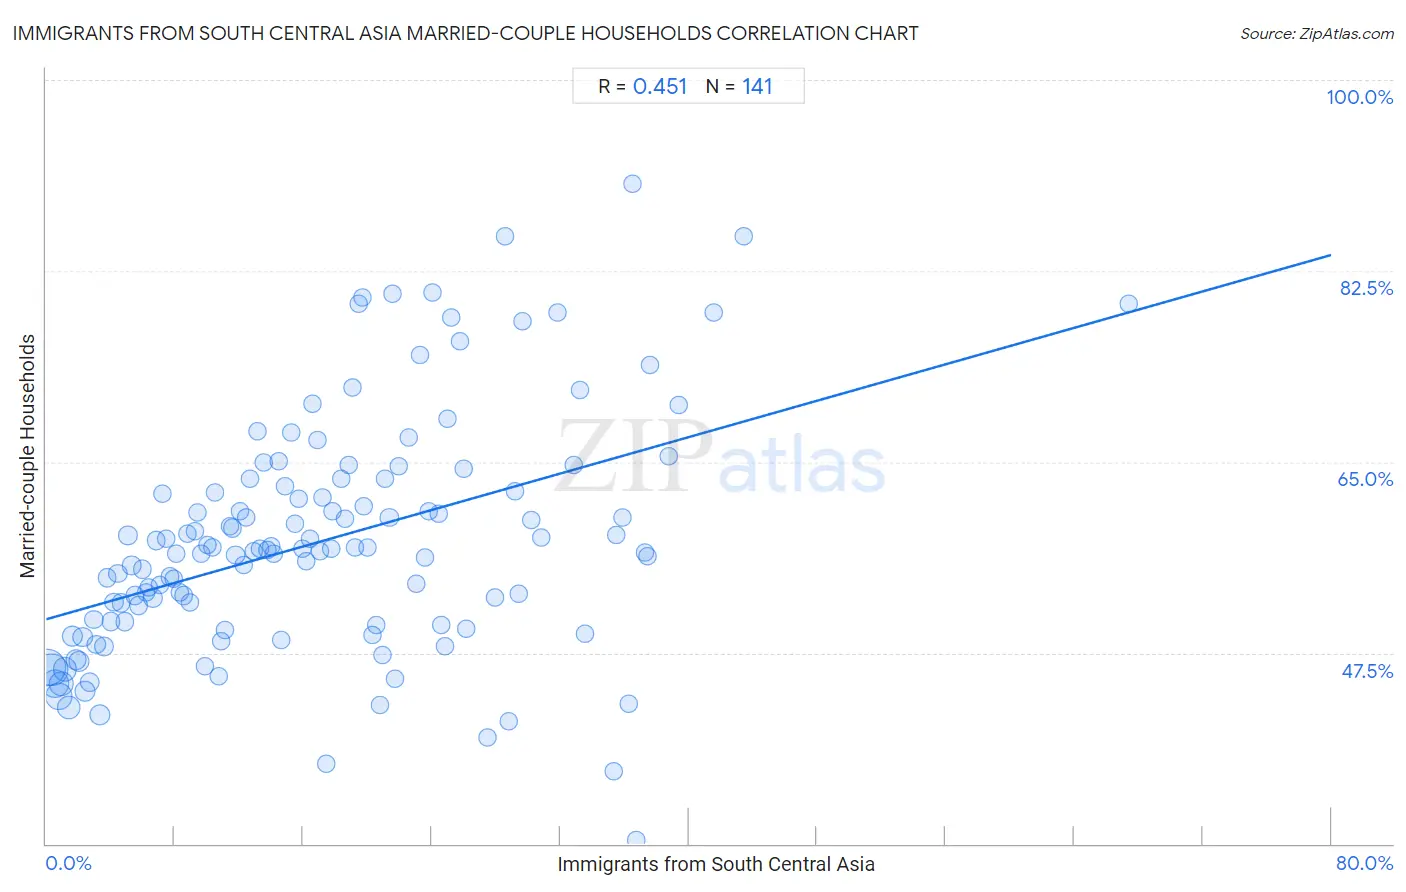
Immigrants from South Central Asia Married-couple Households Correlation Chart
The statistical analysis conducted on geographies consisting of 472,645,847 people shows a moderate positive correlation between the proportion of Immigrants from South Central Asia and percentage of married-couple family households in the United States with a correlation coefficient (R) of 0.451 and weighted average of 50.6%. On average, for every 1% (one percent) increase in Immigrants from South Central Asia within a typical geography, there is an increase of 0.42% in percentage of married-couple family households.
It is essential to understand that the correlation between the percentage of Immigrants from South Central Asia and percentage of married-couple family households does not imply a direct cause-and-effect relationship. It remains uncertain whether the presence of Immigrants from South Central Asia influences an upward or downward trend in the level of percentage of married-couple family households within an area, or if Immigrants from South Central Asia simply ended up residing in those areas with higher or lower levels of percentage of married-couple family households due to other factors.
Demographics Similar to Immigrants from South Central Asia by Married-couple Households
In terms of married-couple households, the demographic groups most similar to Immigrants from South Central Asia are Pennsylvania German (50.4%, a difference of 0.55%), Chinese (50.4%, a difference of 0.55%), Filipino (51.0%, a difference of 0.64%), Danish (51.1%, a difference of 0.86%), and Immigrants from Pakistan (50.1%, a difference of 1.0%).
| Demographics | Rating | Rank | Married-couple Households |
| Immigrants from India | 100.0 /100 | #1 | Exceptional 52.7% |
| Immigrants from Taiwan | 100.0 /100 | #2 | Exceptional 52.4% |
| Thais | 100.0 /100 | #3 | Exceptional 51.9% |
| Assyrians/Chaldeans/Syriacs | 100.0 /100 | #4 | Exceptional 51.8% |
| Tongans | 100.0 /100 | #5 | Exceptional 51.6% |
| Danes | 100.0 /100 | #6 | Exceptional 51.1% |
| Filipinos | 100.0 /100 | #7 | Exceptional 51.0% |
| Immigrants from South Central Asia | 100.0 /100 | #8 | Exceptional 50.6% |
| Pennsylvania Germans | 100.0 /100 | #9 | Exceptional 50.4% |
| Chinese | 100.0 /100 | #10 | Exceptional 50.4% |
| Immigrants from Pakistan | 100.0 /100 | #11 | Exceptional 50.1% |
| Swiss | 100.0 /100 | #12 | Exceptional 49.9% |
| Immigrants from Korea | 100.0 /100 | #13 | Exceptional 49.9% |
| Burmese | 100.0 /100 | #14 | Exceptional 49.8% |
| Koreans | 99.9 /100 | #15 | Exceptional 49.7% |
Immigrants from South Central Asia Married-couple Households Correlation Summary
| Measurement | Immigrants from South Central Asia Data | Married-couple Households Data |
| Minimum | 0.11% | 30.4% |
| Maximum | 67.4% | 90.5% |
| Range | 67.3% | 60.1% |
| Mean | 16.9% | 57.6% |
| Median | 15.5% | 56.9% |
| Interquartile 25% (IQ1) | 7.6% | 50.0% |
| Interquartile 75% (IQ3) | 24.3% | 62.5% |
| Interquartile Range (IQR) | 16.7% | 12.5% |
| Standard Deviation (Sample) | 11.7% | 10.8% |
| Standard Deviation (Population) | 11.6% | 10.8% |
Correlation Details
| Immigrants from South Central Asia Percentile | Sample Size | Married-couple Households |
[ 0.0% - 0.5% ] 0.11% | 90,372,463 | 46.2% |
[ 0.0% - 0.5% ] 0.32% | 68,668,196 | 45.9% |
[ 0.5% - 1.0% ] 0.54% | 49,024,798 | 44.7% |
[ 0.5% - 1.0% ] 0.76% | 41,226,914 | 43.5% |
[ 0.5% - 1.0% ] 0.97% | 30,056,134 | 44.6% |
[ 1.0% - 1.5% ] 1.18% | 25,074,024 | 46.0% |
[ 1.0% - 1.5% ] 1.41% | 24,209,565 | 42.5% |
[ 1.5% - 2.0% ] 1.63% | 13,018,739 | 49.0% |
[ 1.5% - 2.0% ] 1.85% | 13,785,031 | 46.9% |
[ 2.0% - 2.5% ] 2.06% | 10,312,136 | 46.7% |
[ 2.0% - 2.5% ] 2.27% | 9,912,179 | 48.9% |
[ 2.0% - 2.5% ] 2.45% | 11,781,812 | 44.0% |
[ 2.5% - 3.0% ] 2.70% | 8,790,725 | 44.8% |
[ 2.5% - 3.0% ] 2.94% | 4,635,856 | 50.5% |
[ 3.0% - 3.5% ] 3.15% | 5,816,792 | 48.3% |
[ 3.0% - 3.5% ] 3.34% | 13,244,041 | 41.8% |
[ 3.5% - 4.0% ] 3.58% | 3,929,957 | 48.1% |
[ 3.5% - 4.0% ] 3.79% | 3,276,338 | 54.4% |
[ 4.0% - 4.5% ] 4.01% | 3,228,208 | 50.4% |
[ 4.0% - 4.5% ] 4.22% | 3,513,625 | 52.1% |
[ 4.0% - 4.5% ] 4.45% | 2,567,575 | 54.8% |
[ 4.5% - 5.0% ] 4.65% | 2,018,569 | 52.1% |
[ 4.5% - 5.0% ] 4.89% | 1,951,992 | 50.4% |
[ 5.0% - 5.5% ] 5.09% | 2,225,954 | 58.3% |
[ 5.0% - 5.5% ] 5.32% | 1,893,872 | 55.5% |
[ 5.5% - 6.0% ] 5.53% | 1,184,281 | 52.8% |
[ 5.5% - 6.0% ] 5.75% | 1,433,832 | 51.8% |
[ 5.5% - 6.0% ] 5.97% | 1,358,006 | 55.2% |
[ 6.0% - 6.5% ] 6.19% | 1,060,839 | 53.0% |
[ 6.0% - 6.5% ] 6.37% | 735,197 | 53.5% |
[ 6.5% - 7.0% ] 6.64% | 1,862,463 | 52.5% |
[ 6.5% - 7.0% ] 6.82% | 755,220 | 57.8% |
[ 7.0% - 7.5% ] 7.06% | 788,255 | 53.7% |
[ 7.0% - 7.5% ] 7.24% | 486,495 | 62.1% |
[ 7.0% - 7.5% ] 7.48% | 599,420 | 58.0% |
[ 7.5% - 8.0% ] 7.69% | 565,706 | 54.5% |
[ 7.5% - 8.0% ] 7.94% | 554,475 | 54.3% |
[ 8.0% - 8.5% ] 8.13% | 395,200 | 56.5% |
[ 8.0% - 8.5% ] 8.34% | 1,170,614 | 53.1% |
[ 8.5% - 9.0% ] 8.55% | 831,629 | 52.7% |
[ 8.5% - 9.0% ] 8.77% | 729,360 | 58.4% |
[ 8.5% - 9.0% ] 8.96% | 418,342 | 52.1% |
[ 9.0% - 9.5% ] 9.22% | 718,541 | 58.7% |
[ 9.0% - 9.5% ] 9.41% | 360,910 | 60.4% |
[ 9.5% - 10.0% ] 9.67% | 556,611 | 56.5% |
[ 9.5% - 10.0% ] 9.86% | 414,572 | 46.2% |
[ 10.0% - 10.5% ] 10.06% | 516,387 | 57.3% |
[ 10.0% - 10.5% ] 10.33% | 806,876 | 57.2% |
[ 10.5% - 11.0% ] 10.53% | 315,843 | 62.2% |
[ 10.5% - 11.0% ] 10.72% | 178,240 | 45.4% |
[ 10.5% - 11.0% ] 10.92% | 616,482 | 48.6% |
[ 11.0% - 11.5% ] 11.14% | 163,662 | 49.6% |
[ 11.0% - 11.5% ] 11.40% | 162,669 | 59.1% |
[ 11.5% - 12.0% ] 11.62% | 619,845 | 58.9% |
[ 11.5% - 12.0% ] 11.79% | 531,443 | 56.4% |
[ 12.0% - 12.5% ] 12.09% | 258,290 | 60.5% |
[ 12.0% - 12.5% ] 12.29% | 269,322 | 55.5% |
[ 12.0% - 12.5% ] 12.48% | 474,103 | 60.0% |
[ 12.5% - 13.0% ] 12.67% | 251,377 | 63.5% |
[ 12.5% - 13.0% ] 12.93% | 186,706 | 56.9% |
[ 13.0% - 13.5% ] 13.12% | 182,626 | 67.8% |
[ 13.0% - 13.5% ] 13.30% | 223,300 | 57.0% |
[ 13.5% - 14.0% ] 13.55% | 181,618 | 65.0% |
[ 13.5% - 14.0% ] 13.77% | 413,804 | 56.9% |
[ 13.5% - 14.0% ] 14.00% | 50,575 | 57.2% |
[ 14.0% - 14.5% ] 14.20% | 67,388 | 56.6% |
[ 14.0% - 14.5% ] 14.44% | 138,426 | 65.0% |
[ 14.5% - 15.0% ] 14.66% | 332,921 | 48.6% |
[ 14.5% - 15.0% ] 14.82% | 63,656 | 62.8% |
[ 15.0% - 15.5% ] 15.29% | 84,118 | 67.7% |
[ 15.0% - 15.5% ] 15.45% | 264,144 | 59.3% |
[ 15.5% - 16.0% ] 15.74% | 159,820 | 61.6% |
[ 15.5% - 16.0% ] 15.94% | 132,103 | 57.0% |
[ 16.0% - 16.5% ] 16.16% | 254,593 | 55.9% |
[ 16.0% - 16.5% ] 16.42% | 112,568 | 57.9% |
[ 16.5% - 17.0% ] 16.56% | 113,686 | 70.4% |
[ 16.5% - 17.0% ] 16.89% | 180,194 | 67.0% |
[ 17.0% - 17.5% ] 17.08% | 22,030 | 56.8% |
[ 17.0% - 17.5% ] 17.23% | 272,834 | 61.7% |
[ 17.0% - 17.5% ] 17.44% | 16,736 | 37.4% |
[ 17.5% - 18.0% ] 17.73% | 215,024 | 57.1% |
[ 17.5% - 18.0% ] 17.83% | 131,797 | 60.5% |
[ 18.0% - 18.5% ] 18.37% | 6,272 | 63.5% |
[ 18.5% - 19.0% ] 18.57% | 30,578 | 59.8% |
[ 18.5% - 19.0% ] 18.81% | 153,563 | 64.7% |
[ 19.0% - 19.5% ] 19.03% | 129,604 | 71.8% |
[ 19.0% - 19.5% ] 19.20% | 149,814 | 57.2% |
[ 19.0% - 19.5% ] 19.42% | 11,603 | 79.5% |
[ 19.5% - 20.0% ] 19.69% | 13,297 | 80.1% |
[ 19.5% - 20.0% ] 19.77% | 21,152 | 60.9% |
[ 20.0% - 20.5% ] 20.01% | 51,902 | 57.1% |
[ 20.0% - 20.5% ] 20.33% | 22,831 | 49.2% |
[ 20.5% - 21.0% ] 20.51% | 68,761 | 50.0% |
[ 20.5% - 21.0% ] 20.77% | 33,513 | 42.7% |
[ 20.5% - 21.0% ] 20.92% | 14,804 | 47.3% |
[ 21.0% - 21.5% ] 21.09% | 127,930 | 63.4% |
[ 21.0% - 21.5% ] 21.36% | 210,788 | 59.9% |
[ 21.5% - 22.0% ] 21.54% | 1,207 | 80.4% |
[ 21.5% - 22.0% ] 21.72% | 24,229 | 45.1% |
[ 21.5% - 22.0% ] 21.98% | 74,839 | 64.7% |
[ 22.5% - 23.0% ] 22.57% | 228,795 | 67.2% |
[ 22.5% - 23.0% ] 23.00% | 64,268 | 53.8% |
[ 23.0% - 23.5% ] 23.28% | 37,671 | 74.7% |
[ 23.5% - 24.0% ] 23.60% | 88,402 | 56.3% |
[ 23.5% - 24.0% ] 23.79% | 50,125 | 60.4% |
[ 24.0% - 24.5% ] 24.06% | 22,796 | 80.5% |
[ 24.0% - 24.5% ] 24.46% | 8,257 | 60.2% |
[ 24.5% - 25.0% ] 24.58% | 38,567 | 50.0% |
[ 24.5% - 25.0% ] 24.81% | 37,194 | 48.1% |
[ 25.0% - 25.5% ] 25.00% | 312 | 69.0% |
[ 25.0% - 25.5% ] 25.19% | 53,464 | 78.2% |
[ 25.5% - 26.0% ] 25.72% | 5,206 | 76.1% |
[ 25.5% - 26.0% ] 25.98% | 42,760 | 64.4% |
[ 26.0% - 26.5% ] 26.16% | 44,127 | 49.7% |
[ 27.0% - 27.5% ] 27.46% | 5,018 | 39.8% |
[ 27.5% - 28.0% ] 27.96% | 15,702 | 52.6% |
[ 28.5% - 29.0% ] 28.55% | 802 | 85.7% |
[ 28.5% - 29.0% ] 28.80% | 184 | 41.2% |
[ 29.0% - 29.5% ] 29.17% | 3,695 | 62.3% |
[ 29.0% - 29.5% ] 29.41% | 34 | 52.9% |
[ 29.5% - 30.0% ] 29.66% | 5,867 | 77.9% |
[ 30.0% - 30.5% ] 30.21% | 18,068 | 59.7% |
[ 30.5% - 31.0% ] 30.78% | 2,560 | 58.1% |
[ 31.5% - 32.0% ] 31.85% | 16,722 | 78.7% |
[ 32.5% - 33.0% ] 32.84% | 341 | 64.7% |
[ 33.0% - 33.5% ] 33.22% | 20,264 | 71.5% |
[ 33.5% - 34.0% ] 33.51% | 37,689 | 49.2% |
[ 35.0% - 35.5% ] 35.30% | 1,425 | 36.6% |
[ 35.0% - 35.5% ] 35.50% | 20,693 | 58.3% |
[ 35.5% - 36.0% ] 35.86% | 15,585 | 59.9% |
[ 36.0% - 36.5% ] 36.30% | 146 | 42.9% |
[ 36.0% - 36.5% ] 36.48% | 2,300 | 90.5% |
[ 36.5% - 37.0% ] 36.72% | 1,999 | 30.4% |
[ 37.0% - 37.5% ] 37.30% | 2,241 | 56.7% |
[ 37.0% - 37.5% ] 37.40% | 44,570 | 56.3% |
[ 37.5% - 38.0% ] 37.56% | 39,565 | 73.9% |
[ 38.5% - 39.0% ] 38.78% | 37,022 | 65.5% |
[ 39.0% - 39.5% ] 39.38% | 1,153 | 70.3% |
[ 41.5% - 42.0% ] 41.58% | 2,549 | 78.7% |
[ 43.0% - 43.5% ] 43.40% | 212 | 85.7% |
[ 67.0% - 67.5% ] 67.38% | 141 | 79.5% |